

Value stream mapping: what it is and how to do VSM?
Value Stream Mapping (Value Stream Mapping – VSM) is a practical lean thinking tool that visually reveals where processes accumulate delays, rework or waste, always looking from the customer's point of view.
By mapping both the material flow and the information flow, teams can prioritize interventions that generate real impact. Read the rest of this content for step-by-step instructions, real examples and tips for turning the diagnosis into measurable improvements.
Keep reading to learn more about VSM.
What is Value Stream Mapping (VSM)?
VSM consists of mapping all the steps required to deliver value to the customer, pointing out each part of the process, waiting time, inventory and information flow. In the lean context, it helps you see improvement opportunities and eliminate waste along the chain.
Unlike other traditional flowcharts, which normally detail the steps of a process without necessarily considering value, VSM has a specific focus on the flow of materials and information that generate value for the customer.
It quantifies and analyzes activities, separating those that add real value from those that merely consume resources, activities that lean calls waste.
In addition, while ordinary flowcharts offer a sequential view of the steps, VSM provides an integrated and strategic view of the process, from start to finish, considering the impacts on total time, inventories and waits that affect the delivery of value.
This approach helps align the entire organization around an understanding of what really matters to the customer, allowing improvement efforts to be directed toward eliminating bottlenecks and increasing the efficiency of the value stream as a whole.
Learn more about VSM in the video below:
What is VSM (Value Stream Mapping) for?
VSM is used to identify bottlenecks, waste (muda) and opportunities for correction, creating a clear view of the current state of the process and designing a more efficient future scenario.
The main objectives of VSM include:
- Detailed diagnosis of waste in the process.
- Clear visualization of bottlenecks that affect the flow.
- Alignment across areas for collaborative improvement.
- A structured basis for planning and implementing improvements.
- Definition and tracking of key performance indicators (KPIs) to measure results.
See a practical example of VSM
At a manufacturing company, value stream mapping revealed that 60% of the total lead time was spent waiting for manual approvals and for records that required rework.
Based on this, the team implemented an automatic rule for approving orders below a certain value and a standardized checklist for data entry at the source.
The result was a 40% reduction in lead time and a 70% drop in rework, improving efficiency and customer satisfaction.
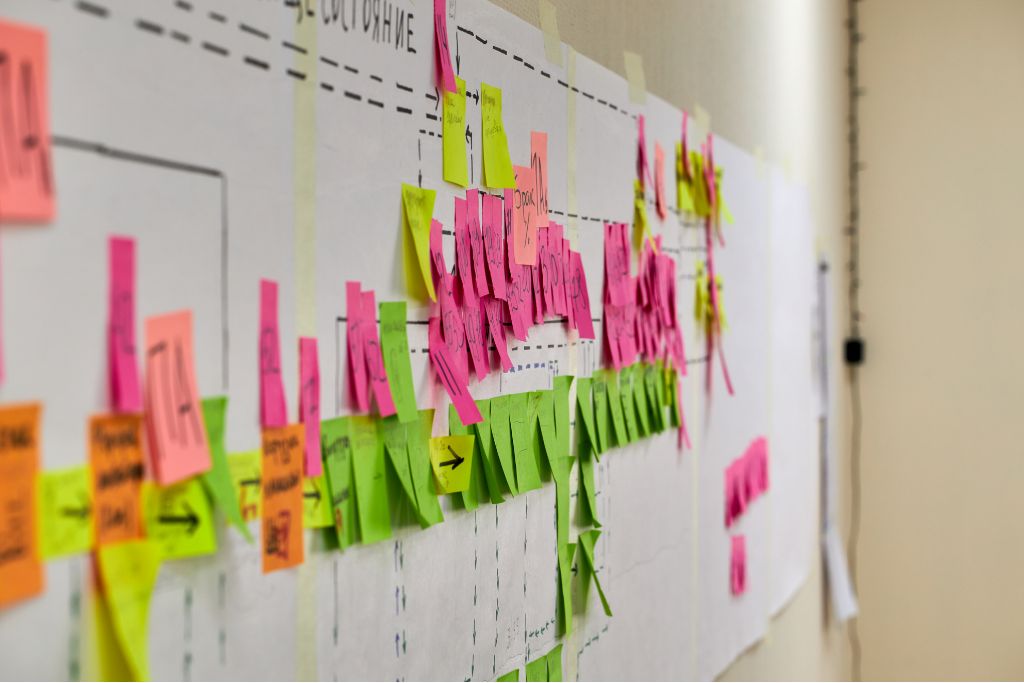
Figure 1 — Visual value stream mapping (VSM) board with colored sticky notes, showing steps, bottlenecks and process improvements.
Why is VSM the starting point for the lean transformation?
VSM is fundamental because it reveals the end-to-end flow of the process, making it possible to identify the root cause of the main wastes. It offers a clear, detailed view of the entire flow of materials and information, facilitating an accurate diagnosis of the most critical problems.
In addition, VSM is the basis for defining the desired future state of the process and drawing up the lean implementation plan, which includes Kaizen projects and other strategically aligned continuous improvement initiatives.
Finally, VSM connects teams and leadership, facilitating strategy deployment, such as the use of Hoshin Kanri, and the effective prioritization of the actions that will have the greatest impact on the business.
Here is a summary of the 3 strategic reasons:
- Full visibility of the flow and of the causes of waste.
- A basis for planning the future state and lean projects (Kaizen).
- Strategic alignment and prioritization through Hoshin Kanri.
Where and when should VSM be applied?
Value Stream Mapping (VSM) is an extremely versatile tool — it is not limited to the shop floor. It is useful whenever you need to see the real flow (materials and information), identify waste and prioritize actions with a direct impact on the customer.
Below we explain where to apply it, when to apply it, and practical examples to illustrate.
Where to apply VSM?
It is important to understand where to apply this tool, that is, in which contexts and scopes it is worth investing effort in applying it. See some examples below:
- Industry / manufacturing: assembly lines, component flow, final assembly processes.
- Healthcare: patient journeys (admission → triage → exam → discharge), hospital pharmacy processes, scheduling.
- Services / Back office: accounts payable/receivable, purchase orders, customer service, customer onboarding.
- Logistics / Supply Chain: receiving → storage → picking → shipping; routing.
- IT / Software development: delivery pipeline (idea → backlog → development → QA → deploy), incident management.
- Projects and launches: integration across areas (marketing, sales, product, operations).
Examples of recommended scope:
- End-to-end: when the goal is to understand the complete flow through to the customer (ideal for large systemic problems).
- Sub-flow: when the problem is more localized (e.g., billing process, triage queue in an emergency room). Start small if it is your first time.
When to apply VSM?
We also need to know when to apply this tool, that is, the most common triggers that create the need to carry out these actions. See some examples below:
- When lead time is high or varies a lot.
- When there are recurring customer complaints (delays, inconsistent information).
- Before starting an automation project to ensure you automate the right process.
- After a significant change (system migration, layout change, outsourcing).
- To prepare a Kaizen/A3 Event, that is, when VSM provides the diagnosis and priorities.
- When there are signs of cannibalization, rework or excess inventory.
- In strategic planning to prioritize initiatives that reduce lead time or cost.
Practical examples of applying VSM
Below are some practical examples (illustrative cases) that can help you better understand how this tool applies to your company's day-to-day operations. Check them out!
Assembly line (manufacturing)
- Context: The assembly line has daily variations in production and late deliveries.
- VSM application: Map the current flow (parts receiving → assembly → inspection → packaging → shipping), measure cycle times, waiting time and WIP levels.
- Typical result: Identification of a bottleneck at the test station → redistribution of operators + line balancing → reduced lead time and less work-in-process inventory.
Emergency room (healthcare)
- Context: Long waiting time at triage and delays in exams.
- VSM application: Map the patient journey from arrival to discharge, including the information flow (exam orders, results).
- Typical result: Discovery that the release of exams depends on a manual signature in another department → creation of a digital/parallel analysis flow → reduction in the patient's total length of stay.
Accounts payable (back office)
- Context: Invoices coming due and late-payment penalties.
- VSM application: Map invoice receipt → approval → posting → payment. Measure approval times between areas.
- Typical result: Identification of manual resubmissions between departments (lost time) → standardization of fields and approval rules + electronic approval → cycle reduced by days and less interest paid.
How does value stream mapping work in practice?
Mapping is usually carried out through collaborative workshops involving cross-functional teams directly connected to the process.
The methodology includes steps for data collection and analysis, visualization of the current flow, identification of waste and design of the ideal future flow.
The workshop typically lasts 1 to 3 days, which can vary depending on the complexity of the process and the defined scope.
After the intensive initial stage, there is continuous follow-up to implement improvements and review results.
Prework is recommended to collect essential data, such as cycle times, inventories, frequencies and bottlenecks already identified, so that the workshop is more productive and focused on critical analysis.
In mapping, the main roles are:
- Facilitator: leads the workshop, maintains focus and facilitates communication among participants.
- Sponsor: a leader who supports the project, sets priorities and ensures strategic alignment.
- Operators and team members: specialists and people responsible for operations who bring practical knowledge of the real flow and collaborate in identifying problems and solutions.
This approach ensures that VSM is a living tool that connects shop-floor knowledge to business strategy, driving consistent and sustainable improvements.
What are the main VSM symbols and elements?
These symbols are essential for building clear, standardized maps, making it easier to understand the process visually and identify improvement opportunities.
- Material flow: represents the physical movement of items, parts or products throughout the production or service process.
- Information flow: indicates communication, data exchange and commands between process steps, such as orders, authorizations or production signals.
- Lead time: total time required from the start until value is delivered to the customer, including waits and inventories.
- Cycle time: actual execution time of each step or operation in the flow.
- Inventory: quantity of materials, work in process or stock accumulated between steps in the flow.
- FIFO: acronym for “First In, First Out” — a method of organization in which the first items in are the first out, used to control flow and avoid accumulation.
- Operators: people or teams directly involved in the tasks and processes, who are essential for identifying improvements in the flow.
How do you build an effective Value Stream Map? Complete step by step
For each step, use clear instructions, verification checklists and spreadsheet templates to collect data and metrics. Tools such as VSM templates, cause-analysis forms and visual dashboards help standardize and speed up the process.
- Define the objective and scope: Clarify which process will be mapped, the main objective (reduce lead time, eliminate waste, etc.) and the boundaries of the flow to be analyzed.
- Select the team and collect data: Put together a multidisciplinary team (operators, managers, specialists) and gather preliminary data using collection spreadsheets, interviews or direct observation.
- Draw the current state: Use the “walk the progress” method — physically walk the flow to visualize each step, identify failures and understand connections.
- Analyze times/data: Gather metrics such as lead time, cycle time, waiting time, amount of inventory and percentage of value added at each step.
- Identify waste and causes: Use checklists to look for the eight lean wastes; link each finding to its main causes, ranking them by impact.
- Draw the future state: Design the ideal flow by removing or reducing waste, reorganizing activities and standardizing steps to maximize value.
- Implementation plan with quick wins and projects: Structure quick-win actions and more complex lean projects, prioritizing by effort vs. potential impact.
- Metrics and review: Define tracking indicators, such as lead time, % value added and the number of wastes eliminated; schedule regular reviews to ensure continuous improvement.
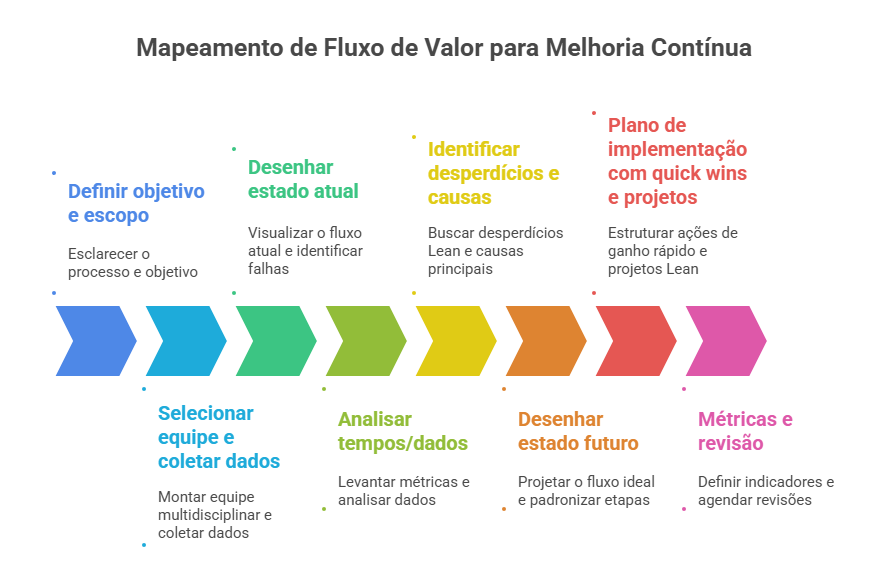
Figure 2 — Discover the steps of value stream mapping (VSM) and how to apply this tool for continuous improvement in your process.
How does VSM help identify and eliminate lean waste day to day?
VSM is fundamental for mapping the 8 main lean wastes (muda) and showing visually how they appear in the process flow:
- Overproduction: excess production or items made before they are needed. In VSM, it appears as high inventories or production ahead of schedule. Correction: implement pull production and leveling.
- Waiting: long idle times waiting for steps, approvals or resources. Long lead-time lines on the map are typical. Correction: balance resources, synchronize activities, speed up approvals.
- Transportation: unnecessary movement between areas or steps. Bubbles and convoluted flows in the VSM point to the problem. Correction: reorganize the layout, bring activities closer together and use visual systems.
- Overprocessing: activities or steps that do not add direct value, such as rework and bureaucracy. On the map, overly detailed or repeated processes are a warning sign. Correction: simplify routines, standardize processes.
- Inventory: materials or products accumulated beyond what is needed. Represented by inventory symbols between steps. Correction: adjust the replenishment policy, reduce batch sizes and adopt Kanban.
- Motion: unnecessary movement of people, tools or information. Observed in long paths, crossovers and too many manual steps. Correction: apply 5S, redesign workstations.
- Defects: nonconforming products, rework or scrap. Shown by returns to earlier steps and correction loops. Correction: invest in inspection at the source, Poka-Yoke and training.
- Wasted talent: underuse of people's skills and knowledge. On the map, this may be evidenced by the absence of operators in the discussion or by ignored suggestions. Correction: foster engagement, encourage participation in improvements.
See a practical example of VSM
In a VSM at a manufacturing company, excess inventory appeared as bubbles between areas and waiting as long lines in the lead time.
After the redesign, the team implemented Kanban and reduced bureaucratic steps, eliminating bottlenecks and shortening delivery time.
By making waste explicit on the map, VSM facilitates the correction plan, guiding improvement projects and enabling tracking through clear performance indicators.
What are the main benefits of VSM for the company?
VSM brings direct advances in process management, team alignment and strategic results:
- Reduced lead time: less time from the start until delivery to the customer, reflecting faster, more agile processes.
- Lower inventory: leaner stock between steps thanks to the elimination of waiting and excess, freeing up capital and space.
- Reduced rework: fewer corrections and do-overs by identifying and tackling the causes of defects and bottlenecks.
- Alignment across areas: greater collaboration, clear communication and synchronized workflow between different departments.
- Data-driven decisions: improvements and priorities are guided by objective metrics and analysis of the real flow.
- Improved organizational culture: strengthening of continuous improvement behavior and collective engagement.
- Team engagement: teams participate and feel responsible for results and for the evolution of processes.
- Greater predictability and quality: more consistent results and high delivery standards, benefiting customers and stakeholders.
What KPIs are recommended to track the gains from VSM?
Measurement is essential to turn the VSM diagnosis into concrete results. Well-chosen KPIs show whether the changes have reduced flow time, increased the value delivered to the customer and reduced waste, in addition to guiding priorities in the next iterations.
Below are the main KPIs used to monitor VSM:
- Total process lead time: time elapsed from the start until delivery to the customer. It is the guiding indicator for assessing whether VSM is effectively shortening the flow and improving delivery speed.
- Percentage of Value-Added (VA) vs. Non-Value-Added (NVA) time: the proportion of time during which the activity actually transforms the product/service for the customer (VA) compared with waits, rework and inspections (NVA). Increasing %VA is a direct sign of reduced waste.
- Cycle time per step: measurement of the average time each activity in the flow takes. It identifies specific bottleneck points and makes it possible to prioritize local actions with the greatest impact on lead time.
- OTIF (On Time In Full): percentage of deliveries made on the scheduled date and in the correct quantity/scope. It shows the effect on customer deliveries — an improvement in flow should be reflected in a higher OTIF.
- WIP (Work In Process): number of items in progress within the flow. A high WIP level tends to increase lead time and variability; controlling WIP is a direct lever for reducing time and improving predictability.
These indicators, tracked regularly (e.g., weekly/biweekly dashboards) and linked to clear targets, translate the real impact of VSM and help maintain focus on sustainable results and continuous evolution.
What are the challenges of applying VSM in a company?
Implementing Value Stream Mapping (VSM) brings great opportunities for gains, but also real challenges that can compromise results if they are not anticipated.
Below we list the most common barriers found in companies and practical actions to mitigate each of them, so that VSM generates fast and sustainable impact. Check it out!
- Lack of reliable data: incomplete or inaccurate information makes a realistic map difficult.
Mitigation: invest in structured collection and standardized checklists, and involve the operational team in validating the data. - Cultural resistance: changes in habits and transparency can create insecurity or rejection.
Mitigation: promote open communication, involve teams from the start and celebrate small wins to build engagement. - Poorly defined scope: mapping ambiguous or overly broad processes compromises focus and results.
Mitigation: be clear when defining the start and end of the flow and align objectives with all participants. - Limited resources: lack of time, dedicated leadership or tools can stall progress.
Mitigation: prioritize quick wins, use free templates and encourage shared responsibilities. - Lack of follow-through: improvements that are identified but not implemented lead to demotivation.
Mitigation: set up regular review meetings and assign owners for each action through to implementation.
The role of engaged lean leadership is crucial to overcoming these barriers, sustaining the discipline of continuous improvement and removing obstacles day to day.
To deepen your mastery of VSM in practice, explore advanced mechanisms, solutions and tools in the dedicated course: value stream mapping at Lean Learning.
Frequently asked questions about Value Stream Mapping (VSM)
Is VSM applied only in industry?
No. Although it originated in manufacturing, VSM can be applied to any workflow involving materials or information: healthcare, services, back office, IT, logistics and digital products.
Tip: adapt the vocabulary (e.g., “patient” or “ticket”) to your operational context to make team engagement easier.
What is the difference between VSM and a flowchart?
A flowchart describes steps and decisions; VSM goes further: it maps the entire flow from the customer's point of view, measures lead time, cycle time, inventories/WIP and the information flow, making it possible to identify waste and prioritize improvements.
Tip: use flowcharts to detail sub-processes and VSM for the end-to-end view and prioritization.
What information is collected when creating a VSM?
Process steps, cycle times, waiting times, inventory/WIP between steps, frequencies (batch size), rework/defect rates, transport times and information flow (orders, approvals, systems). Also record owners and current metrics (lead time, %VA).
Tip: start with simple measurements and validate them with the operation — estimated data are useful if well documented.
What are the “current state” and the “future state” in VSM?
The current state is the real representation of how the flow works today, with real data and problems. The future state, on the other hand, is the target design with proposed improvements (less NVA, shorter lead time, more stable flow).
Tip: prioritize quick wins in the desired future and define experiments to validate changes.
How long does it take to do a complete VSM?
It depends on the scope: a sub-flow can take from a few hours to a day; a typical end-to-end VSM is usually done in 1–3 days of workshop (map + analysis) and weeks to implement actions.
Tip: start with a lean pilot to build confidence and generate quick results.
Who should take part in building the VSM?
The people who do the work (operations), a facilitator, the process owner, representatives of the areas involved (control/quality/IT/internal customer) and, ideally, someone from leadership for support.
Tip: including those who “do” the work is essential to identify real causes and gain commitment.
Does VSM replace other lean methodologies?
No — VSM complements other lean tools (5S, Kaizen, A3, PDCA). It is a diagnostic and prioritization instrument that guides which methods to apply next.
Tip: use VSM to identify where to apply A3s, Kaizen events or POCs.
Can VSM be used in digital projects?
Yes. In software development and digital products, VSM helps map cycles (idea → backlog → dev → QA → deploy) and reduce lead time, queues and rework.
Tip: represent CI/CD pipelines, PR queues and review times as steps in the flow.
How often should VSM be reviewed?
Periodic reviews (e.g., quarterly) are recommended, or whenever there is a significant change (new tool, reorganization, demand peak). Redo the map after implementing improvements to validate the gains.
Tip: combine regular reviews with indicators (KPIs) that trigger a new analysis when targets are not met.
Is it possible to do VSM on your own?
It is possible to start on your own to structure ideas, but an effective VSM requires team participation to gather real data, validate observations and build commitment. On your own, you run the risk of mapping an incomplete view.
Tip: use your initial version as a draft and invite the team to validate it in a hands-on workshop.
Do I need advanced tools to do a VSM?
No — simple tools (kraft paper, sticky notes, pens and a timeline) are sufficient and often preferable in the discovery phase. Software and digital templates help with documentation and sharing later.
Tip: opt for digital tools only when you need to collaborate with remote teams or maintain a historical repository.
How can Lean Institute Brasil help your company put VSM into practice?
We turn the Value Stream Mapping diagnosis into practical changes that generate results. We work from mapping through follow-up, ensuring that the actions designed in the workshop become real improvements in day-to-day operations.
Here is what we deliver for your company:
- Hands-on workshops: we facilitate sessions with the operational team to map the real flow, collect data and design a feasible future state.
- Prioritized action plan: we translate the map into concrete initiatives — quick wins, medium-term projects and defined owners.
- Consulting: we support implementation with mentoring and follow-up routines to consolidate gains and ensure sustainability.
We support companies from different sectors with applied methodology, ready-to-use templates and a focus on measurable results.
Want to implement lean and VSM in your company? Talk to our specialists or explore lean courses and cases to accelerate your journey.

Figure 3 — Hands typing on a laptop with a screen showing "Value / Customer / Strategy", illustrating digital prototyping and customer-focused product validation.
Conclusion
Value stream mapping is the starting point for turning processes into a competitive advantage.
Structure the map, measure results and implement rapid improvement cycles — with committed leadership and discipline — to generate continuous, scalable gains.
And count on Lean Institute Brasil to apply VSM in your company.


