
Farm management: planting lean in agribusiness
Photo taken by the author at the farms mentioned here.
Preparing the ground
To sow and to produce, as we have learned on our walks through farms over these last few years, you first need to prepare the ground. And that is what we have been doing in the most recent projects we have carried out in the agribusiness sector: educating people to prepare the base and learn the fundamentals.
The profile of the direct workforce in this sector tends to be, generally, people with a low level of schooling, and this was where one of the main difficulties in starting a project lay. We needed to find the most suitable way to communicate, so that it would be effective for everyone.
Although lean principles are very simple in essence, they are counterintuitive, and therefore require greater effort to be understood.
The starting point was to work on raising awareness and training employees and leaders in basic concepts, so that they would become familiar with the methods and with some of the principles that would guide the next steps and that would create the conditions for concrete actions, providing better conditions for carrying out experiments, following the logic of “learning by doing”.
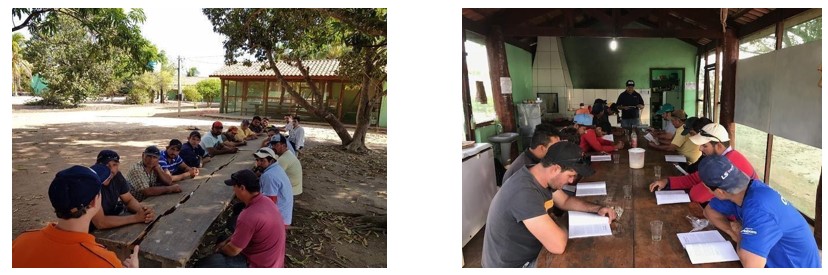
Photos 1 and 2: Basic education: group reading and discussion of the book “Everything I Know About Lean I Learned in First Grade”.
These activities helped raise the team's awareness of the project and also, in and of themselves, ended up generating some simple improvement initiatives that could be implemented immediately.
Deploying guidelines and planning production cycles
The right time to buy inputs, the correct time for planting, the moment to put animals out to pasture or bring them in, etc. are some of the crucial day-to-day decisions on the farm. However, planning on farms is something that happens, to a large extent, based on intuition: people simply know and do, but in a very informal way and, almost always, very differently each time, varying from person to person.
So, right after the initial awareness-raising, the next step was to lay out, in a highly visual way, the main needs to be met, step by step, providing input for the following stages. The planning phases needed to be made clearer and the information available to everyone. This was essential because of the long production cycles of crop farming and livestock. The results of poor planning only show up when it is too late, which means an entire harvest or an entire herd will already have been affected.
Planning started from what the farms already had, which was, basically, highly aggregated information about the production cycles – an annual schedule for each crop season (figure 1). Soon after, these were deployed into quarterly plans (figure 2) and fortnightly plans (figure 3), reaching the daily level of management. In this way, the key phases of a production cycle became known to everyone, making the work of managers and field teams easier.
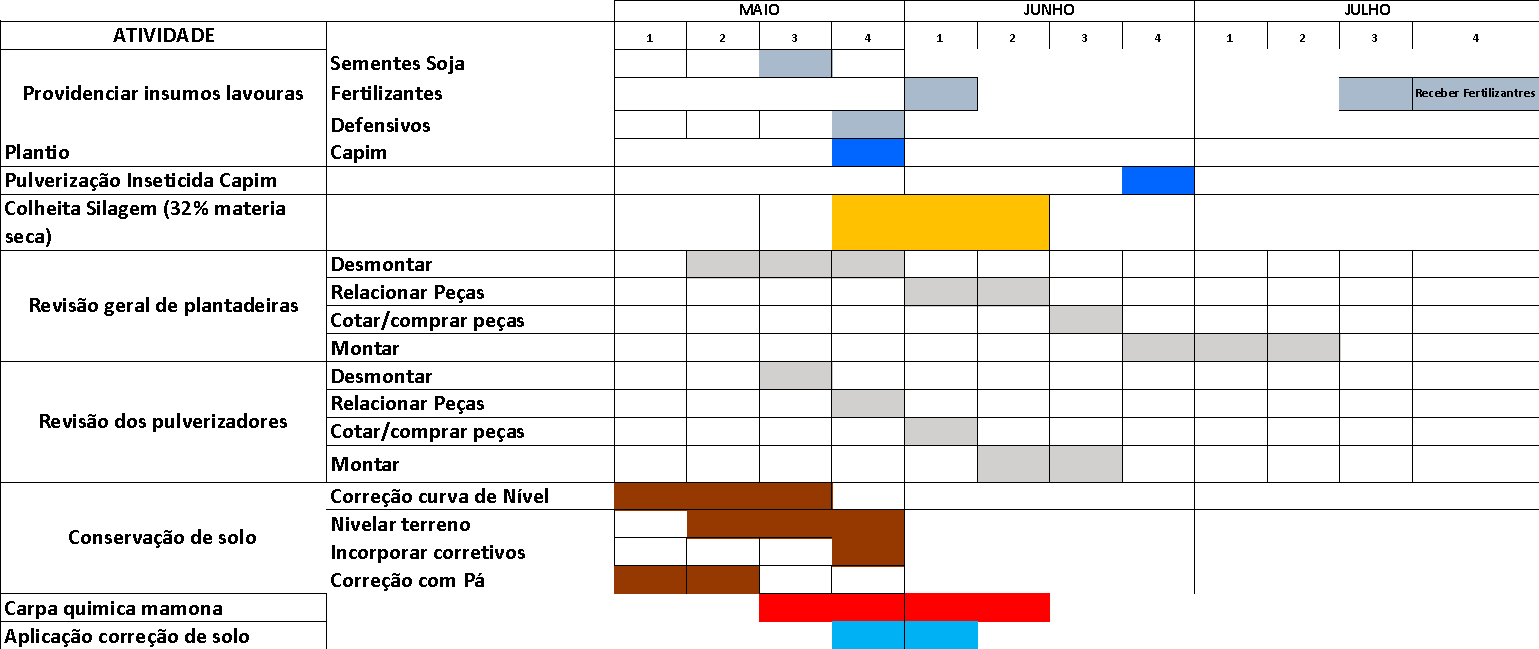
Figure 1: Previous situation – annual macro plan
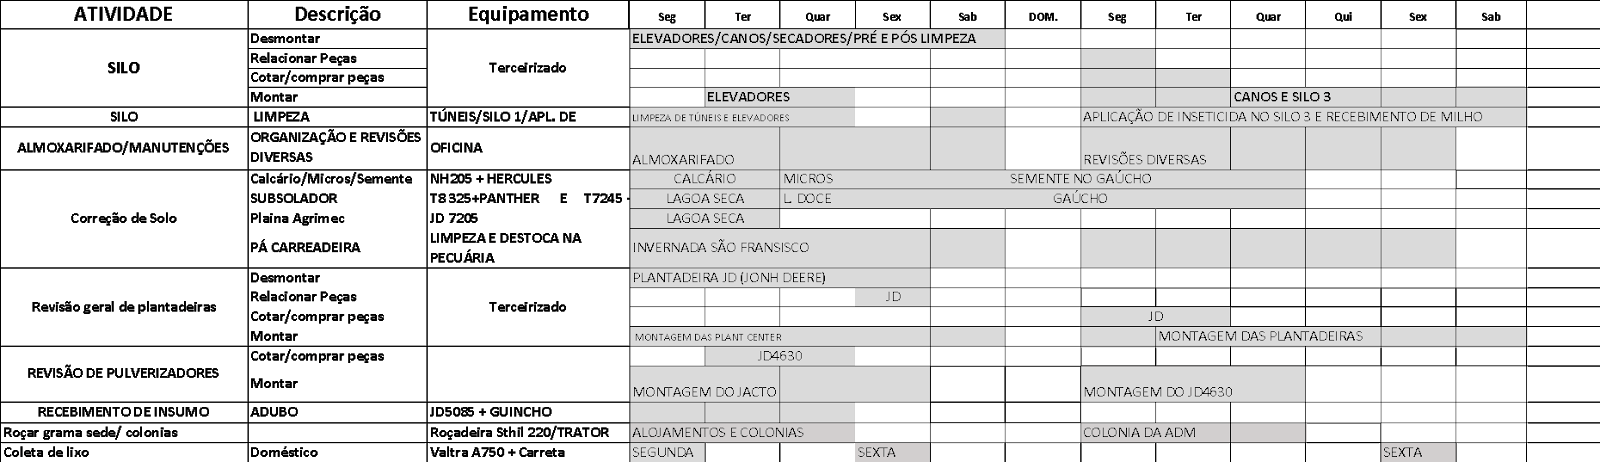
Figure 2: After improvement – deployment into the quarterly plan
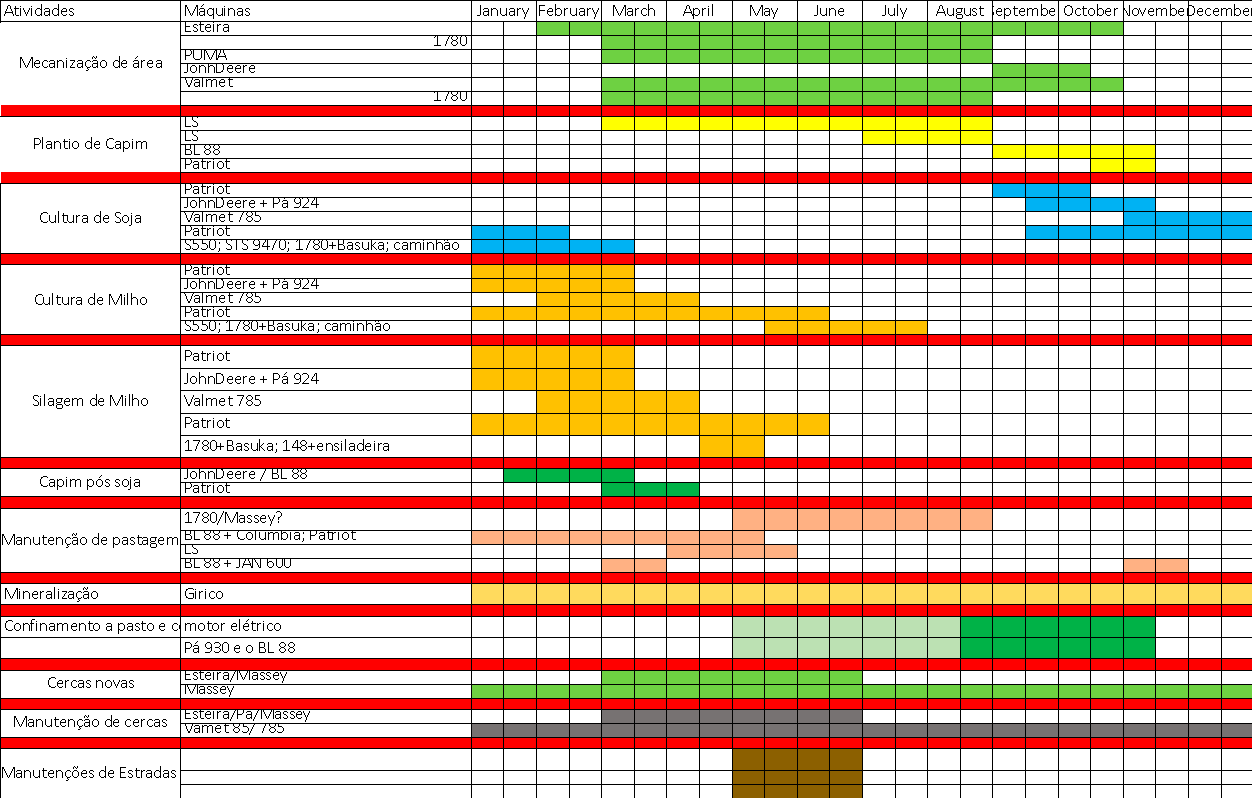
Figure 3: After improvement – deployment of the quarterly plan into a fortnightly plan
This deployment logic was used for the various work fronts, both for crops (soil preparation and maintenance, planting, spraying and harvesting) and for livestock (breeding, rearing, handling and fattening of the animals). With the same perspective, capacity-versus-demand planning was carried out to make the most of the use of machinery and equipment (figure 4), labor and other resources – which are often shared among the various activities.
Seeing things this way is important, from a business perspective, in order to know whether the machinery and equipment are sufficient in number and in adequate condition to meet the needs of each production stage, avoiding unnecessary outsourcing or purchases and investments.
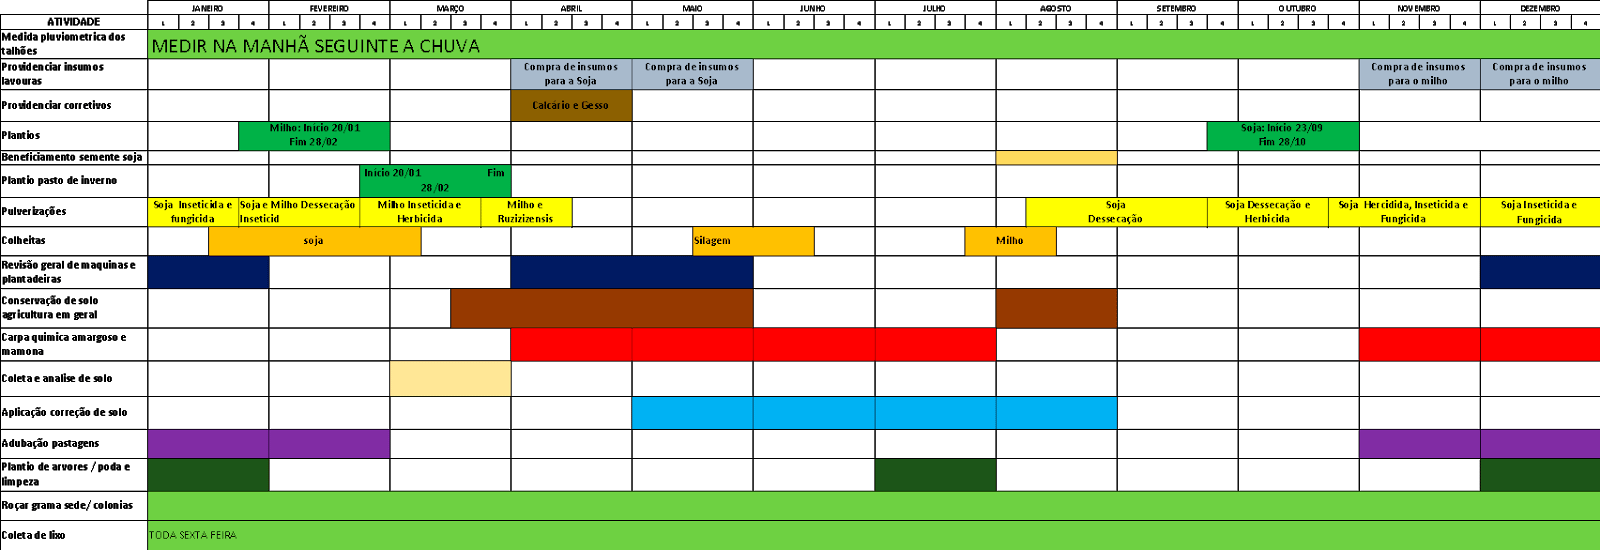
Figure 4: Planning the use of machinery and equipment
Also as part of the planning, the foundations were built for the indicators, targets and other metrics that would guide the work and decision-making, connecting the strategic level to the operational level. Some of the indicators that were measured and tracked are:
- A) Crops – planting (in ha/day); production (in sacks/ha); harvest losses (in kg/ha – crops); coefficient of variation of distribution (seeds, fertilizer); production costs (in R$/ha).
- B) Livestock – average daily weight gain (ADG) of the animals during the growth phases, age and weight at weaning, pregnancy rates in artificial insemination protocols; production costs (R$/@), among others.
Revitalizing the management system
After planning, we went to the gemba to learn how things were done day to day. As with planning, we could see great opportunities to improve the execution of the work, making it more stable, clear and productive.
One of the situations that caught everyone's attention was that, if the planter was not correctly calibrated during planting, there could be failures in the distribution of seeds, leading to two possible situations: 1) too many seeds falling, which would create a high concentration of plants and greater competition among them, affecting productivity; and 2) fewer seeds falling than desired, which would cause underuse of the soil, since there would be fewer plants per linear meter, per hectare, and it would also affect the overall result. In both cases, the consequence would only become visible after germination and could not be corrected.
This realization taught everyone that doing it right the
first time is always essential. You reap what you sow, literally. If the execution
was good, the result will also tend to be good. And so, some concepts were implemented
to help in carrying out the tasks.
1. Daily Management (DM). Starting from the planning deployment shown earlier, we reached the daily levels of execution, implementing a routine for following up on the progress of the work:
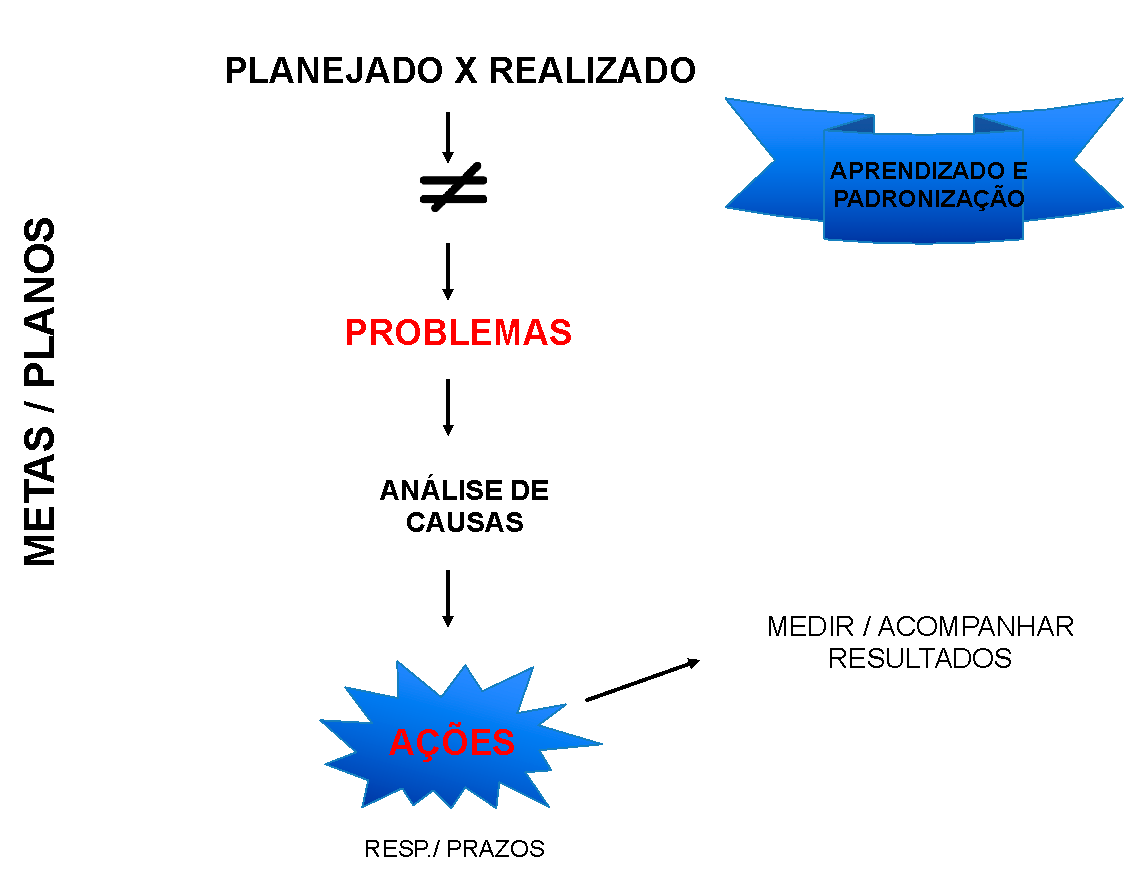
Figure 5: The Daily Management flow
On the farm, farmhands, operators and leaders hold their daily meeting first thing in the morning. In a “war room”, there are the visual management boards that guide the processes (photos 3 and 4). They display the targets, the metrics and the problems that occur day to day, making it possible to prioritize containment actions or those that require more in-depth studies of causality.
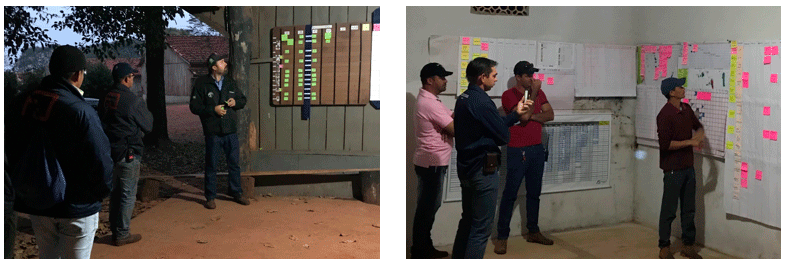
Photos 3 and 4: The Daily Management meetings
The DM meetings last 10 to 20 minutes and are generally divided into four distinct sectors: agriculture, machinery and equipment, livestock and repair/construction of fences. Each of them has different points that need to be observed, but basically we try to bring in elements to know whether the flow of planning and handling of problems is clear and working correctly. These meetings end up making people more comfortable talking about problems without fear, which is one of the principles of the lean philosophy.
2. At the gemba with an eye for opportunities. Being in the areas where the work happens (gemba) is quite common in the agro world. Every day, farmhands, managers and technicians are out in the field. The challenge is to go to the gemba with the right eye, so that they increasingly see waste1.
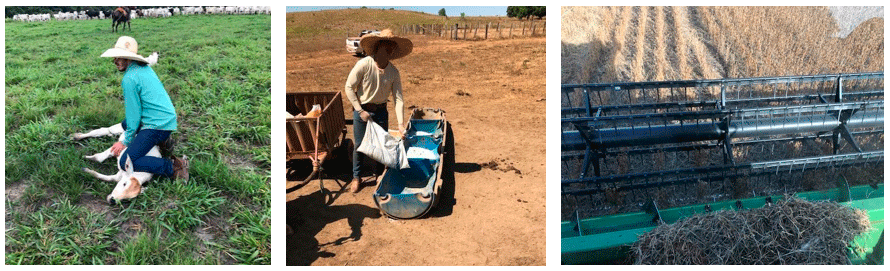
Photo 5: Cattle handling. Photo 6: Putting salt in the troughs. Photo 7: Soybean harvest.
Doing a gemba walk on the farm is a little different from the world of factories and offices. We learned to respect even more the work of the teams who, under the sun or in torrential rain, carry out their activities as best they can (see photos 5 to 7). There are countless opportunities for improvement when you observe the work. What we seek is to provide elements so that they are constantly thinking about a few questions: How can we make what we do safer? How can we reduce time without affecting (or while improving) quality? What can we do to avoid waste? How do we know whether the quality of the work is good or bad?
3. Activity distribution board. For leaders, the job is sometimes to guide the teams on what has to be done during the work day. With this tool, information about what each person will do on each day of the week becomes visual, making it possible for anyone to know where effort is being allocated.
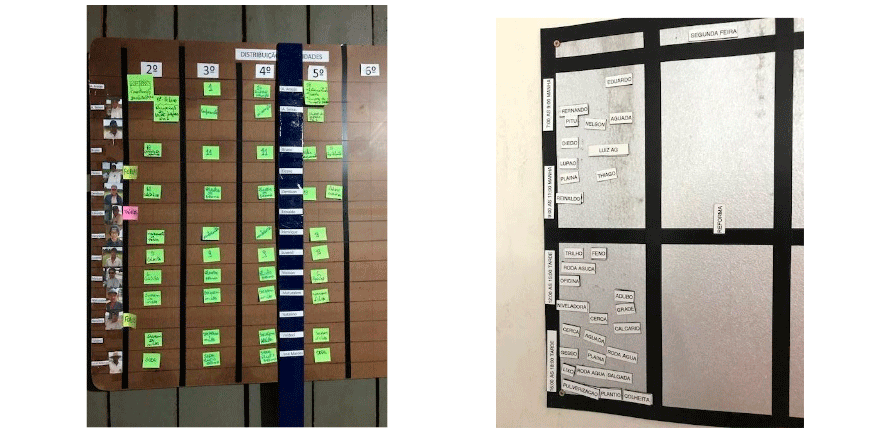
Photos 8 and 9: Activity distribution boards.
4. Skills Matrix2. Assigning the right person to the right activity is a step further. The level of training of the employees was very different for each activity that needed to be carried out. So, when someone on the team was absent, it was not clear who could (or whether anyone could) take over the task. To map the skill levels of each employee, seeing their development in the different production stages, this concept was introduced (see photo 10).
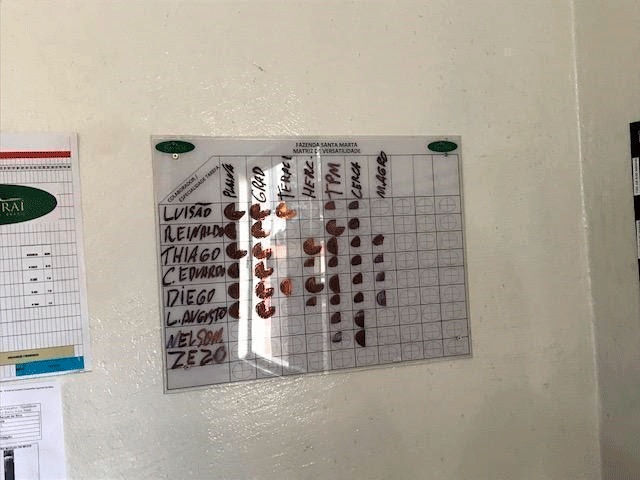
Photo 10: Skills Matrix
We believe that, besides working with the usual heavy tools, people need opportunities to practice intellectual development, feeling part of the improvement in performance and the satisfaction of taking good initiatives; documenting and gathering the improvements achieved, reporting progress, questioning the steps, analyzing the progress of activities, all of this makes everyone feel part of the journey.
That is why we suggested that the improvements made to the processes be made visible, and the way to do this was to document and share the before and after moments of the interventions (figure 6). In this way, the initiatives and commitment of the team members are valued, making them feel responsible for the progress. In the example below, we can see that the information about the next filter and oil changes for the machines was all kept in a notebook (on the left). We moved this information onto a board, where it is visual and makes follow-up easier for the team of operators and for maintenance.
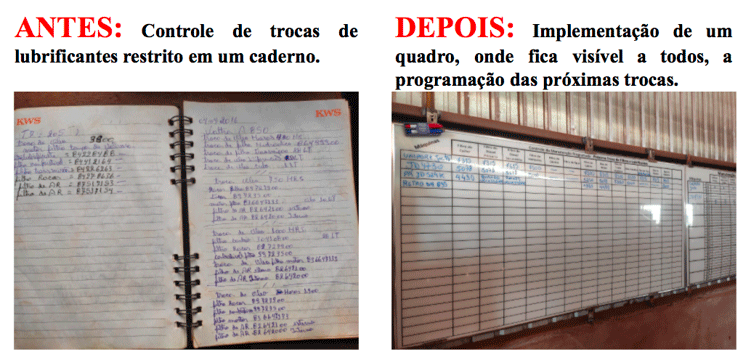
Figure 6: Before and after comparison – example of visual management in the workshop.
What to measure and how to track the metrics
How do we know whether we are doing well (or badly) in our activities day by day, cycle by cycle, hour by hour? Is this important? How are our performance and our cost? What needs to improve? How much does it need to improve?
Over the course of the projects, we could see that there were few forms of measurement on the farms where we worked, and this made it harder to answer the questions above. Creating and refining existing parameters whose purpose, basically, is to make it possible to tell whether the work is right or wrong, whether the processes are good or bad, whether the workload relative to capacity means a lot or a little, and whether the pace of the processes (relative to what was planned) puts them ahead of or behind schedule was a priority so that everyone could see how things were going.
Measuring is important, but in some cases the frequency with which you measure is decisive for the usefulness of what the measurement reveals. In other words, obviously we want to compare one harvest with another in terms of total sacks or tonnes harvested, but leaving the tally of that number until the end of an entire cycle means there is no longer time to turn the situation around if the result is negative.
So, ideally, indicators should be connected to operational practices. If at each stage the quality of what is being done is not known, the indicator at the end will be nothing more than a belated finding. Measuring frequently, throughout the process, allows decisions to be made to correct actions and turn the situation around in time.
Through this concept, we sought to connect the strategic indicators to the operational ones. If the day's work is in line with what was expected, the final result should also follow that path. For leaders, the indicators allow adjustments and corrections almost in “real time”, bringing greater control and predictability over performance.
Closing improvement cycles with reflection
At the end of each cycle, we try to reflect on the progress and setbacks, to learn from each stage and see the existing influencing factors, both regarding the progress of the lean project itself and in relation to the processes. We did this by bringing together the work teams, along with the farm owners, to discuss point by point what was done, the difficulties, the results achieved and the benefits of thinking lean (see photos 11 and 12).
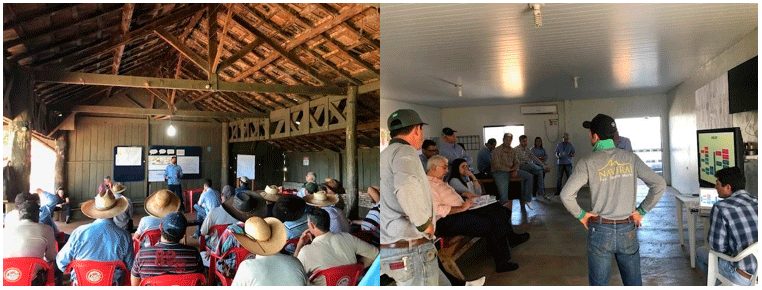
Photos 11 and 12: Reflection on the cycle of improvements and learnings
Analyzing what happened at the process level is also important. One of the ways we did this was by assigning scores to each field plot or production area, rating on various criteria the factors that could possibly influence productivity. Score 1 = green; score 2 = yellow; score 3 = red (from best to worst). In this way, we created tables (see figure 7) to understand the correlations that matter for decision-making, which made it possible to use what was learned from growing corn for the following crop, soybeans, and what was learned in the soybean cycle for the next corn cycle, for example, and so on.
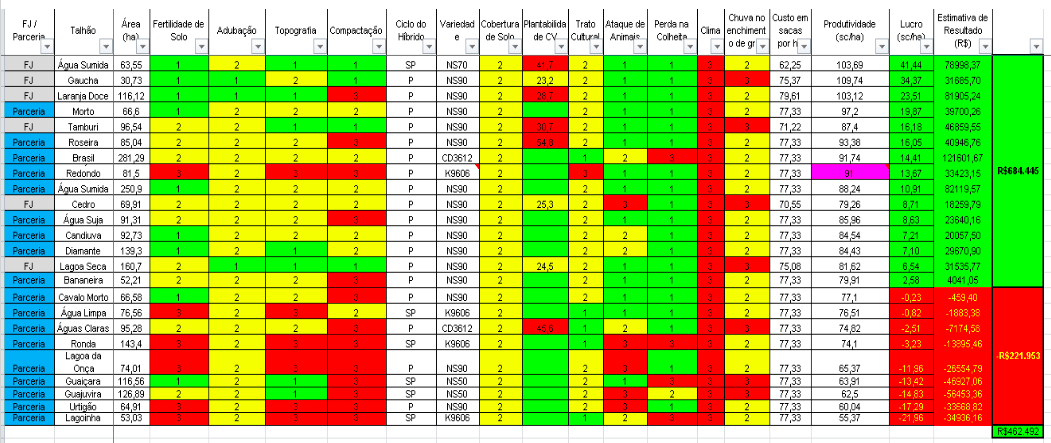
Figure 7: Scoring table
This helped us answer some questions: Which seed variety performed best in each field plot? What were the weather conditions and degradation factors in each area? Was there compaction? How can we score this area in terms of fertility? Is the topography of the land even?
Standardization: acting to stabilize and improve processes
The purpose of having standards in processes is, fundamentally, for them to provide a reference for how the work should be done, “the best way known up to a given moment”, and for that reason they need to be followed by everyone.
We therefore encouraged the creation of standards, to make it easier for new employees to learn, to stabilize and level knowledge among people who had been with the company longer, and to make it possible to “audit” what was in compliance or non-compliance with the standards. In addition, standards help avoid errors and risks that might compromise safety, quality, costs and productivity.
Formatting standards and putting the step-by-step of activities on paper, however, takes a certain amount of effort, and we realized that the pace of this documentation process was not going well. The solution was to suggest using simple resources, such as videos made with mobile phones, to document good practices and the points requiring attention in the various production stages.
Before long, very interesting materials began to emerge covering different activities: planter calibration, FTAI protocol, cattle handling, pest control, etc.
Results
Some of the results obtained in these first projects were quite encouraging, as we will see below.
Example 1: The problem to be solved was that, during the weaning phase, the calves were gaining little weight. It was believed that this was due to the stress the animals were going through or that it was something “normal” for this phase of growth, since they were replacing milk with solid food.
We went to the gemba to understand the process, where we found the following situation, shown in figure 8 below.
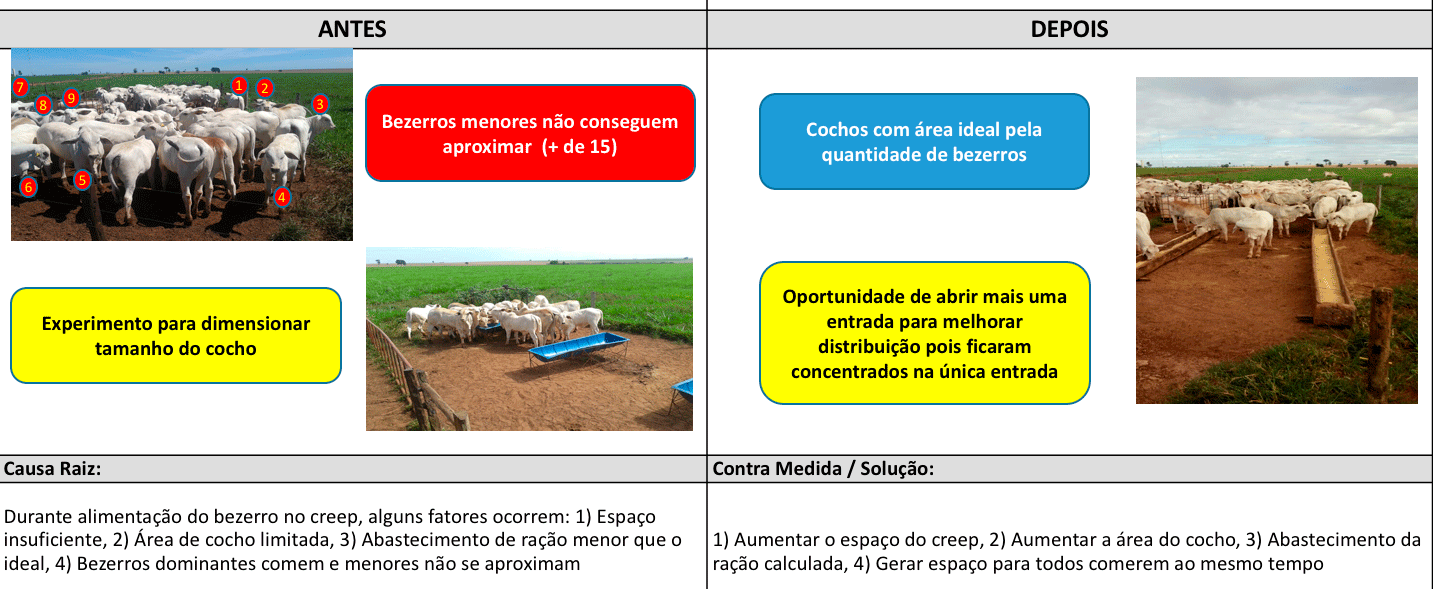
Figure 8: Creep feeding before and after
The creep feeding areas – where feed is provided to the calves – were highly contested. Of the total number of animals, many could not get access to the feed (only the biggest and strongest secured their place at the troughs).
Having understood the process and verified that, in reality, the infrastructure left some calves without access to the nutritional supplement, an adjustment was proposed, extending the line of troughs and opening one more entrance, which allowed better access for a greater number of animals.
With this simple improvement, the average daily weight gain (ADG) of the calves in the weaning phase jumped from 720g/day/animal to 1250 g/day/animal (which represents a 60% increase).
Feed consumption, in turn, increased from 557g/day/animal to 1100g/day/animal (figure 9). This increase, achieved in a few months, represents the target that had been set to be reached in 2 years.
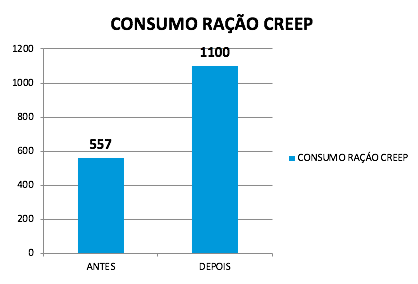
Figure 9: Feed consumption in creep feeding. BEFORE and AFTER comparison
Example 2: The problem in question was the lack of control over grain losses during harvest. Two of the three farms where we worked have outsourced harvesting, where the contractor is paid per hectare harvested. We noticed that grain loss was not measured methodically, only visually… and only every now and then. We began measuring according to methodologies recommended by Embrapa and discovered very high losses (photo 13), ranging from 240 to 550 kg/ha (from 4 to 9 sacks of 60 kg/ha). In more than one case, we inspected the combines and found that they were improperly calibrated or even had cracks and holes in their sieves. Once this was established, the equipment was quickly calibrated and repaired (photo 14), drastically reducing losses to around 60 kg/ha (within the limits considered acceptable by Embrapa and the manufacturers). Measuring losses more frequently then became part of the harvest routine, which generated quite significant gains (in a planted area of 3600 ha, for example, reducing losses by 4 sacks/ha means harvesting 14,400 more sacks, which represents an increase of around R$ 1.2 million in revenue).
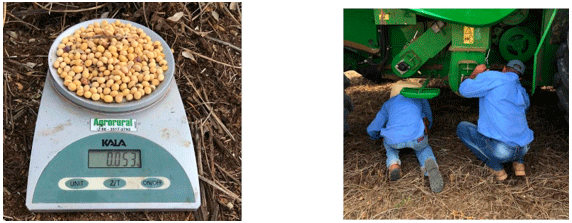
Photo 13: Soybeans collected after the
combine has passed.
Photo 14: Equipment being repaired
to reduce losses
Example 3: The problem was the time spent preparing the spray mixture for crop applications (photo 15). On the operators' own initiative, a “pre-mixer” was created (photo 16), which led to a 35% reduction in the time needed to prepare the mixture for spraying applications, going from 20 minutes to 12.5 minutes for a single load in one sprayer. It is worth remembering that this preparation takes place about 4 times a day per sprayer, which means there was a potential increase of one more application in the period.
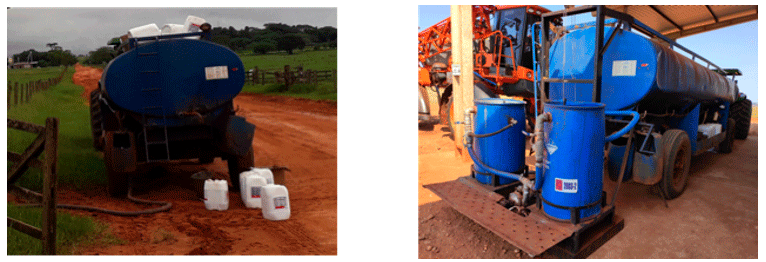
Photos 15 and 16: Spray mixture preparation before and after
Example 4: The following problem was mentioned earlier (irregular distribution of seeds, gypsum and fertilizer). We began measuring the coefficient of variation in distribution – this coefficient needs to be low, since the higher it is, the greater the chance of having double sprouts, planting gaps or poor dispersion of gypsum or fertilizer. Both conditions are detrimental to the expected result.
By taking measurements and calibrating the equipment, we achieved a significant improvement in the coefficients, as shown below (figures 10 and 11).
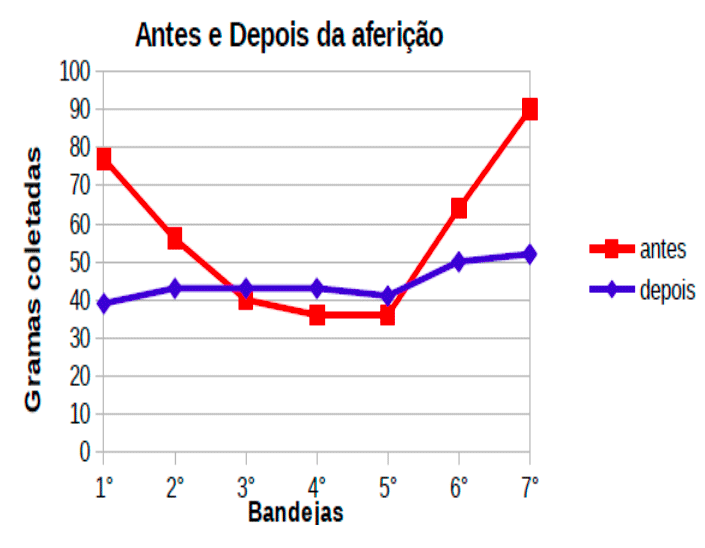
Photo 10: Gypsum dispersion
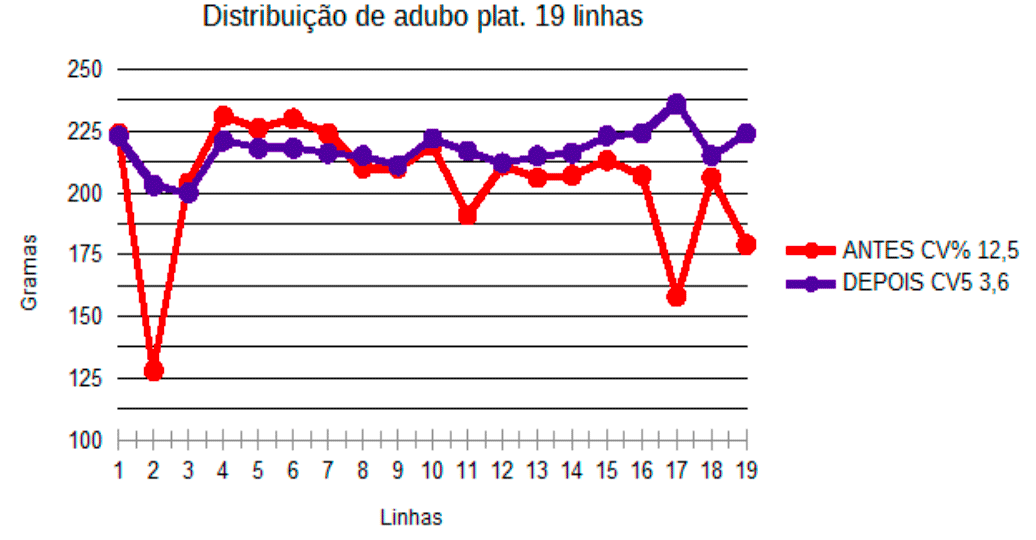
Photo 11: Fertilizer distribution
Example 5: The problem the team faced was the disorganization of the seed discs and rings, which were all mixed up inside a cabinet in the workshop (photo 17). With a simple rack, these parts were stored in an organized way and separated by size. This made it easier to find the right disc at the right time (photo 18).
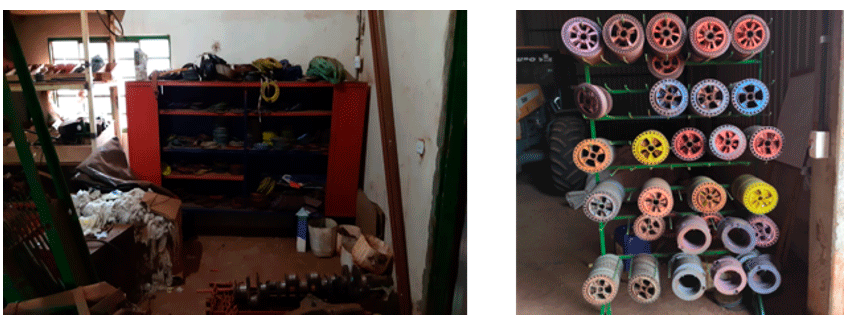
Photos 17 and 18: Discs and rings before and after
Conclusion
We have learned a great deal so far. We had to adapt some concepts and tools for application on farms, but we are certain that the principles and fundamentals of lean remained unchanged, giving us the foundations and direction to follow in the implementation.
In terms of tools, there is enormous potential to expand the use of Value Stream Maps, A3, and others, to identify and mitigate waste systematically. Structuring management systems, in turn, with deployment from the strategic level to the operational level – in Daily Management – ensures that routine activities are aligned with the purpose of the business. Training, engaging and developing leaders for standardized work, the correct practice of the gemba and the kaizen mindset helps boost the performance of processes and people.
The next steps, in our view, are to bring lean to more and more farms, with quality. We are certain that, for it to work, the adoption of lean thinking needs to start from a situational approach. There is no “cookie-cutter recipe” or “roadmap” that is ideal. Each farm is different, with different leaders, with problems that are often similar but that need different handling, case by case. What needs to germinate and grow is the thinking that lies behind the tools. That, indeed, is what produces a good harvest.
The work of lean on farms is just beginning. While this philosophy continues to spread to the most diverse sectors of the economy, we have found a real, practical application for it in the field. In an area so important to society, necessary for supplying food to the entire population, the gains we have seen in these few years of lean application show the potential to increase efficiency in crop farming and livestock, ensuring better use of these basic resources that are so necessary to everyone.
Apply lean principles in the field with lean consulting for agribusiness and achieve a leaner, more productive and more sustainable operation. Less waste, more results and control at every stage of production. Visit the page and find out how!
Footnotes:
- This fosters in people a critical view of the processes, so that they constantly find gaps in their way of working and thus bring forward improvement proposals. With this, improving the day-to-day becomes a complementary part of routine work, using knowledge and creativity to solve a series of small problems to reduce effort and, consequently, produce more, more easily and better.
- This simple tool makes it possible to allocate resources correctly, in addition to showing deficiencies, weaknesses and development gaps, pointing out the people who need training or even those who, by contrast, can already act as knowledge multipliers, training others in a given activity. These are the development levels: 0/4 – does not know the activity; 1/4 has had contact with the activity; 2/4 performs it with supervision; 3/4 performs it without needing supervision; 4/4 can train other people in that activity.
Acknowledgments
To Miguel Sastre (Agropecuária Sastre), Julio Jacintho (Fazenda Vaca Branca) and Claudio Sabino (Fazenda Santa Marta) for providing us with invaluable learning, opening the gates of their properties to the work of Lean Institute Brasil.
To Marcio Carneiro and his team at FJ; Tharles Franchesco and Egidio Tsuji of Copasul; Perivaldo Carvalho, Ronaldo Palma and Cassiano Cavalli of Agropecuária Sastre; among many other people, for their contribution, effort and enthusiasm in planting the lean seeds.
Special thanks to Prof. José Roberto Ferro and Ricardo Itikawa, of LIB, for their mentoring and valuable teachings during the lean projects in agribusiness.
Thanks also to Tamiris Masetto Manzano and Flávio Battaglia for the rounds of review and refinement of this text.