
Lean Thinking practice increases productivity in Vale's railway operation
The Vitória-Minas Railway (EFVM), operated by Vale, is the route used to transport, among other goods, the iron ore (MFE) extracted in Minas Gerais. With a length of 905 km, the railway's main destination is the Tubarão port complex, in the state of Espírito Santo.
Considered one of the safest in the world and one of the most modern railways in Brazil, EFVM needs to continuously raise the productivity of its operations and improve its processes to remain competitive. A relevant indicator for this monitoring is the throughput time of railcars at the MFE loading terminals. Representing the concept of lead time, this throughput time is the length of the railcar's stay at the terminal, measured from its arrival, through loading, to its departure. It is therefore made up of three stages: before, during and after loading.
Railcar throughput time is a result related to the entire logistics chain involved in EFVM: mine, railway and port. This indicator reflects the accuracy of scheduling and asset turnover, in addition to seeking to build credibility with internal and external customers by meeting deadlines. Seeing improvement opportunities to reduce it is important for optimizing the entire logistics chain involved, ultimately resulting in a reduction of waste and, consequently, of costs.
In this context, one of the technical teams responsible for the processes and management of rail operations in the region mobilized to study and implement an improvement project to reduce railcar throughput time at PATRAG[1]. The team adopted the practice of Lean thinking to understand the problem and create countermeasures to address it.
The development of the improvement project was associated with the Practical Lean Training Program - PPFL, offered by Lean Institute Brasil. The PPFL made it possible to combine Lean (a set of principles, concepts and tools to maximize value from the customer's perspective while consuming the minimum of resources) with the technical knowledge and skills of the people involved in the process, including the rail operations engineering team. This gave the group the methodological step-by-step approach to gain greater clarity about the problem and visualize the possible countermeasures to be adopted. In practice, the PPFL made it possible to take Lean to the railway's gemba — the real place where the operation happens.
Operations at the Bulk Transshipment Yard – PATRAG
Located in the rural area of Ouro Preto (MG), the Bulk Transshipment Yard (PATRAG) is a multimodal terminal made up of four railway tracks: one exclusively for gravity unloading of railcars; one for loading and unloading railcars — equipped with a concrete wall at a level higher than the edge of the railcar bodies; and two exclusively for loading railcars. PATRAG also contains four product storage yards, two of which (A and B) are exclusively for MFE, another for miscellaneous products and one more for anthracite (a variety of mineral coal). The improvement project in question focused on the tracks exclusively for loading railcars with MFE and on the terminal's storage yards A and B. Figures 1 to 4 illustrate the terminal and its operations.
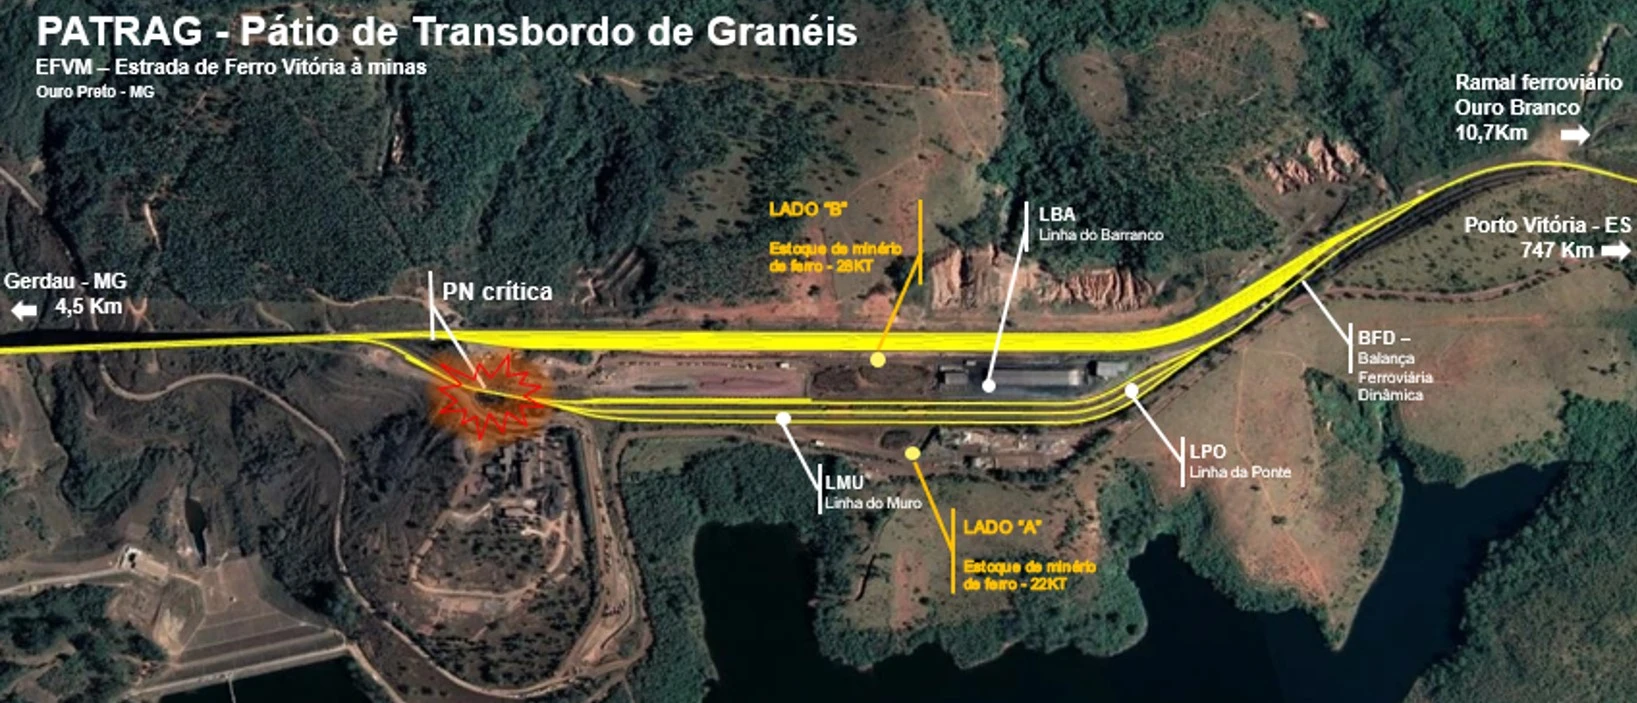
Figure 1 — PATRAG layout (Adaptation: Renato Oliveira)
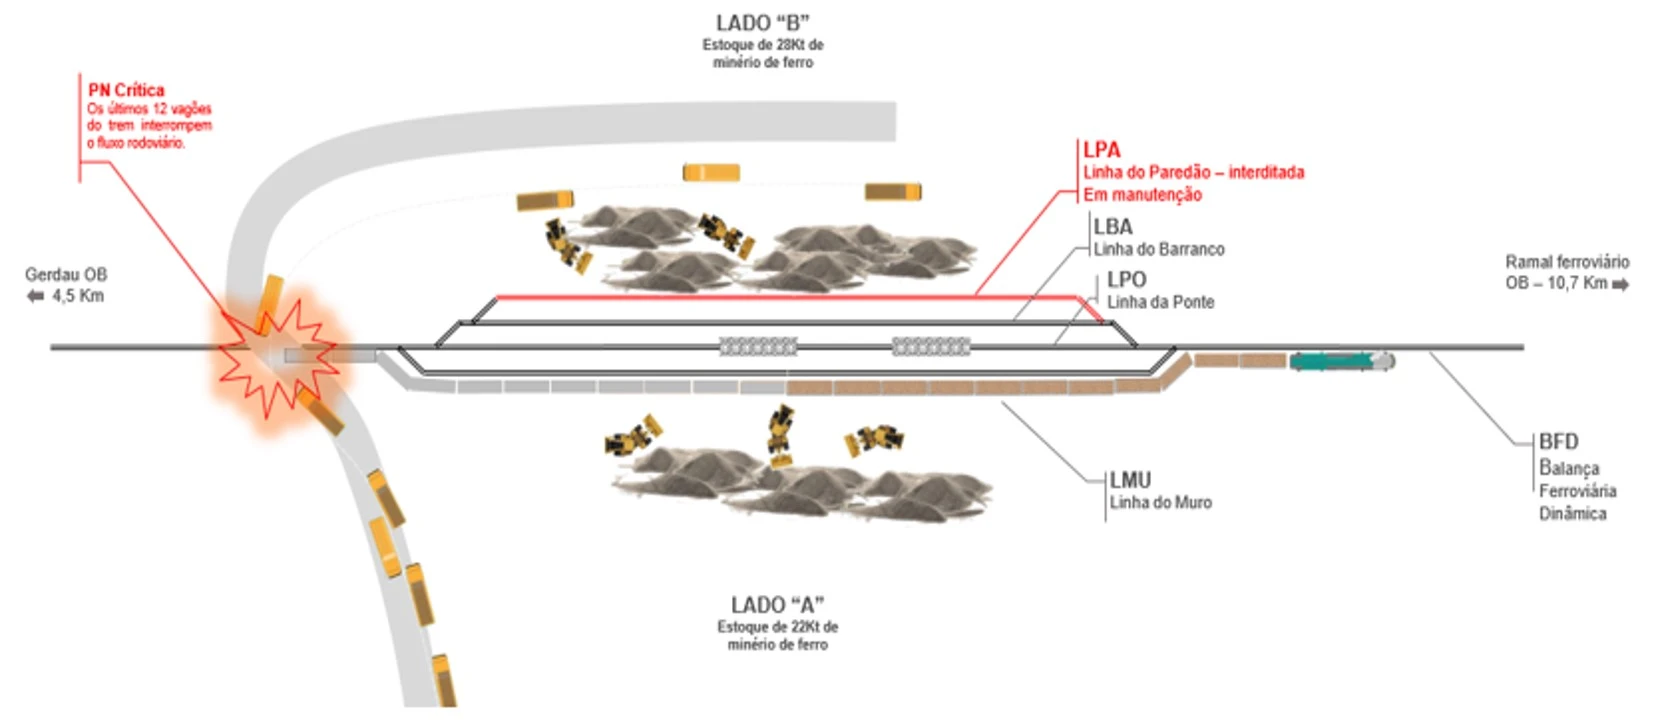
Figure 2 — PATRAG in perspective (Adaptation: Renato Oliveira)
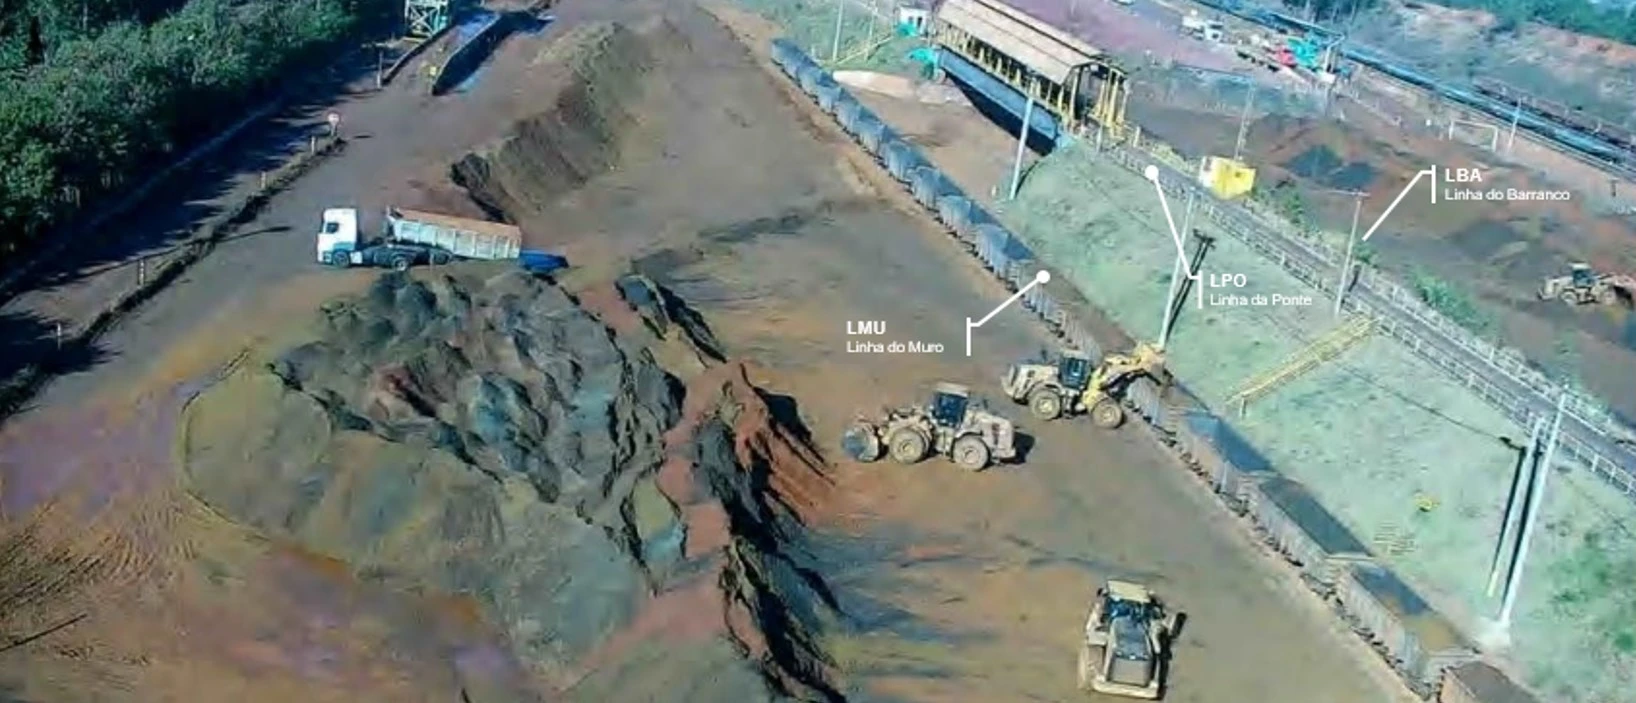
Figure 3 — Yard “A”: railway track/Wall line – PATRAG. (Photo: José Assunção)
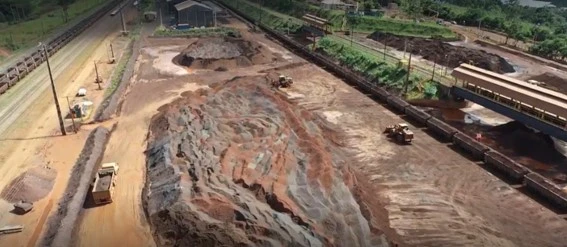
Figure 4 — Yard “B”: railway track/Embankment line – PATRAG. (Photo: Gustavo Teixeira)
The iron ore (MFE) arrives at PATRAG by road, where it is stockpiled in yards A and B. The product is stored in separate piles depending on its physical and chemical quality and other customer specifications. The railcars are then positioned adjacent to the piles, loaded and travel to the port of Tubarão in Vitória (ES).
Building the improvement project using the A3 Process
The improvement team used the A3 Process to structure their understanding of the problem and the definition of countermeasures and actions. The A3 Process is an approach guided by a form in which the problem, the analysis, the countermeasures and the action plan are written on a single sheet of paper (A3 size), usually using charts and figures.
At Toyota, A3 reports evolved into a standard method for problem solving, status reporting and planning exercises. A3 is the international term for a sheet of paper 297 millimeters wide and 420 millimeters long. It allows everyone involved in a given problem to see it from the same perspective.
For John Shook, author of the book “Managing to Learn,” the A3 concept goes much further. He states that it is a management process for developing learning among employees so as to build an organization full of problem solvers.
The A3 Process followed 7 steps that make it possible to select the problem to be addressed, understand it, set targets, analyze it, act on it and follow up on its solution and results. Figure 5 represents the form used in the A3 as the operationalization of the PDCA scientific method (“Plan, Do, Check, Act”, or “Planejar, Fazer, Verificar, Agir” in Portuguese) through the 7 steps of the A3 Process:
- Background
- Current State
- Targets and Objectives
- Cause analysis
- Future State
- Implementation plan
- Monitoring
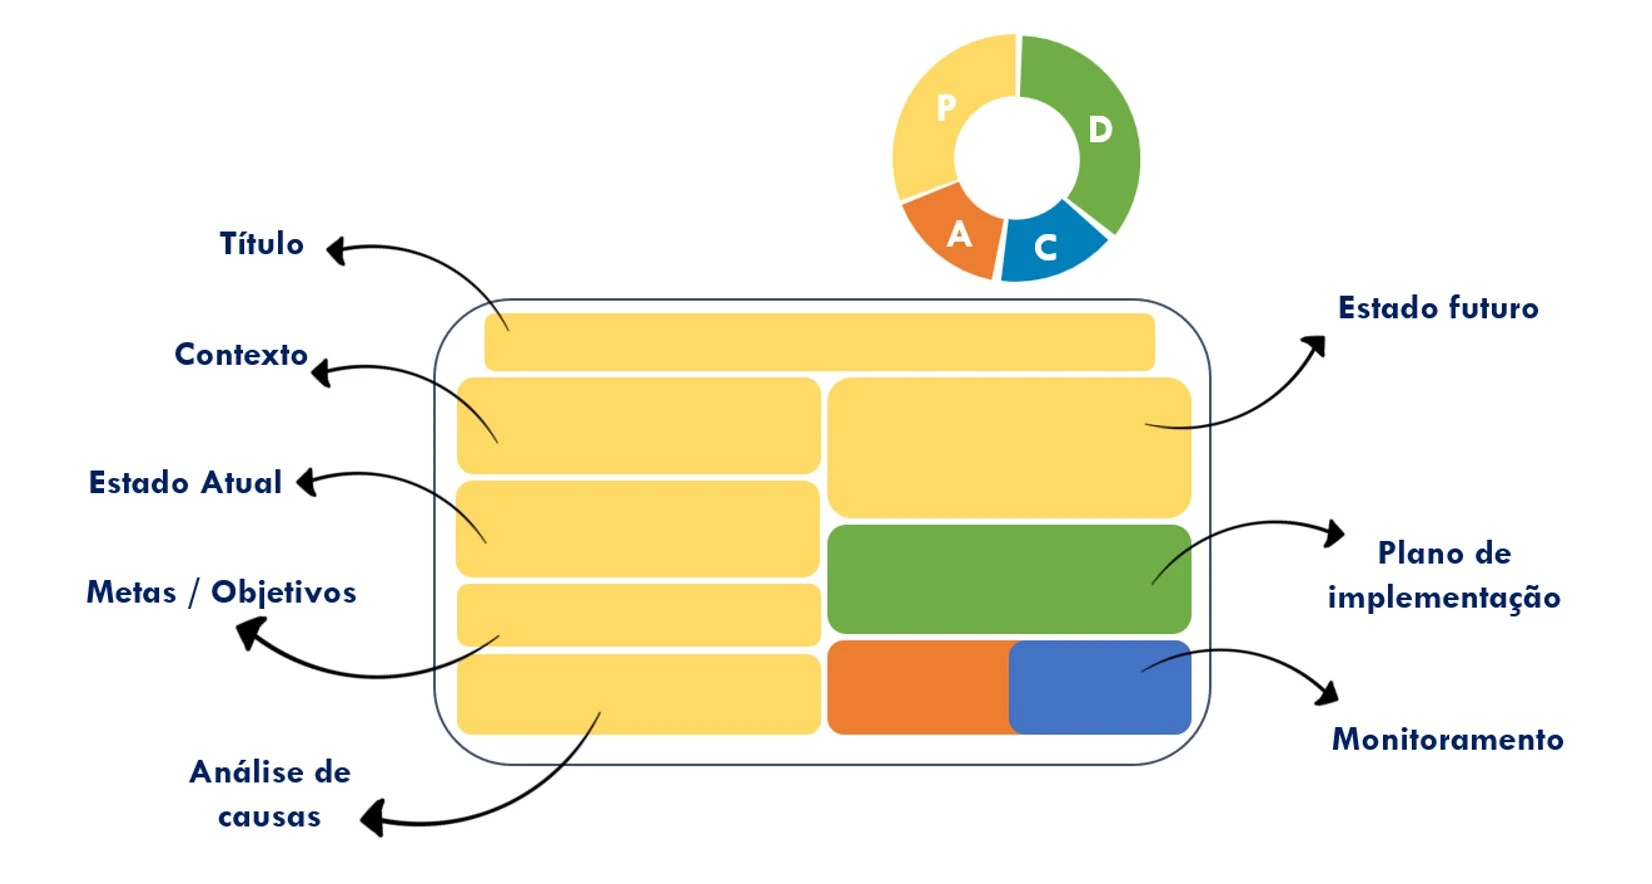
Figure 5 — Scope of the A3 Form that guides the A3 process used in the project and its relationship with PDCA
The A3 Form has two sides: left and right. The clarity and sound understanding built and conveyed by the left side (steps 1 to 4) is the foundation that facilitates actually carrying out the improvement activities and following them up, which is recorded on the right side (steps 5 to 7). Thus, to understand the operational flow and measure the variables that make up railcar throughput time, work began on the “left side” of the A3 Form..
Understanding the Current State and defining the Future State through VSM
In the Current State field (step 2 of the A3 Form), the project team saw the need to identify, analyze, measure and systemically integrate all the activities involved in the terminal's operations macroprocess. To do so, Value Stream Mapping (VSM) was applied, which made it possible to classify the activities in the flow of materials and information into the following categories:
- Value added (VA)
- Necessary but Non-Value-Added (NNVA)
- Non-Value-Added and unnecessary (NVA)
VSM was chosen because it makes it possible to see the flow of the steps in a process, making it possible to identify and eliminate NVA activities, reduce NNVA activities and give focused attention to VA activities. In operational terms at PATRAG, these categories can be exemplified as follows:
- VA: railcars positioned for loading; loading of the railcars;
- NNVA: moving the train to position the railcars; transporting the product from the pile to the railcar;
- NVA: movement of operators; refueling of the mechanical loaders.
The methodological scope for applying VSM followed the structure set out in the book “Learning to See“, by Mike Rother and John Shook. This scope first involves developing the Current State Map, which represents the true flow, with its real problems and waste. Once the current state is well understood, the Future State Map is built, with the improved flow, followed by the Implementation Plan, considering the actions needed to implement the Future State.
The MIRO collaborative visual platform was used to build the VSM. The map was created with standard icons and symbols to identify and represent the flow of materials and information. Through the current state map, railcar throughput time was measured at 932.1 minutes. The Current State map is shown in Figure 6.
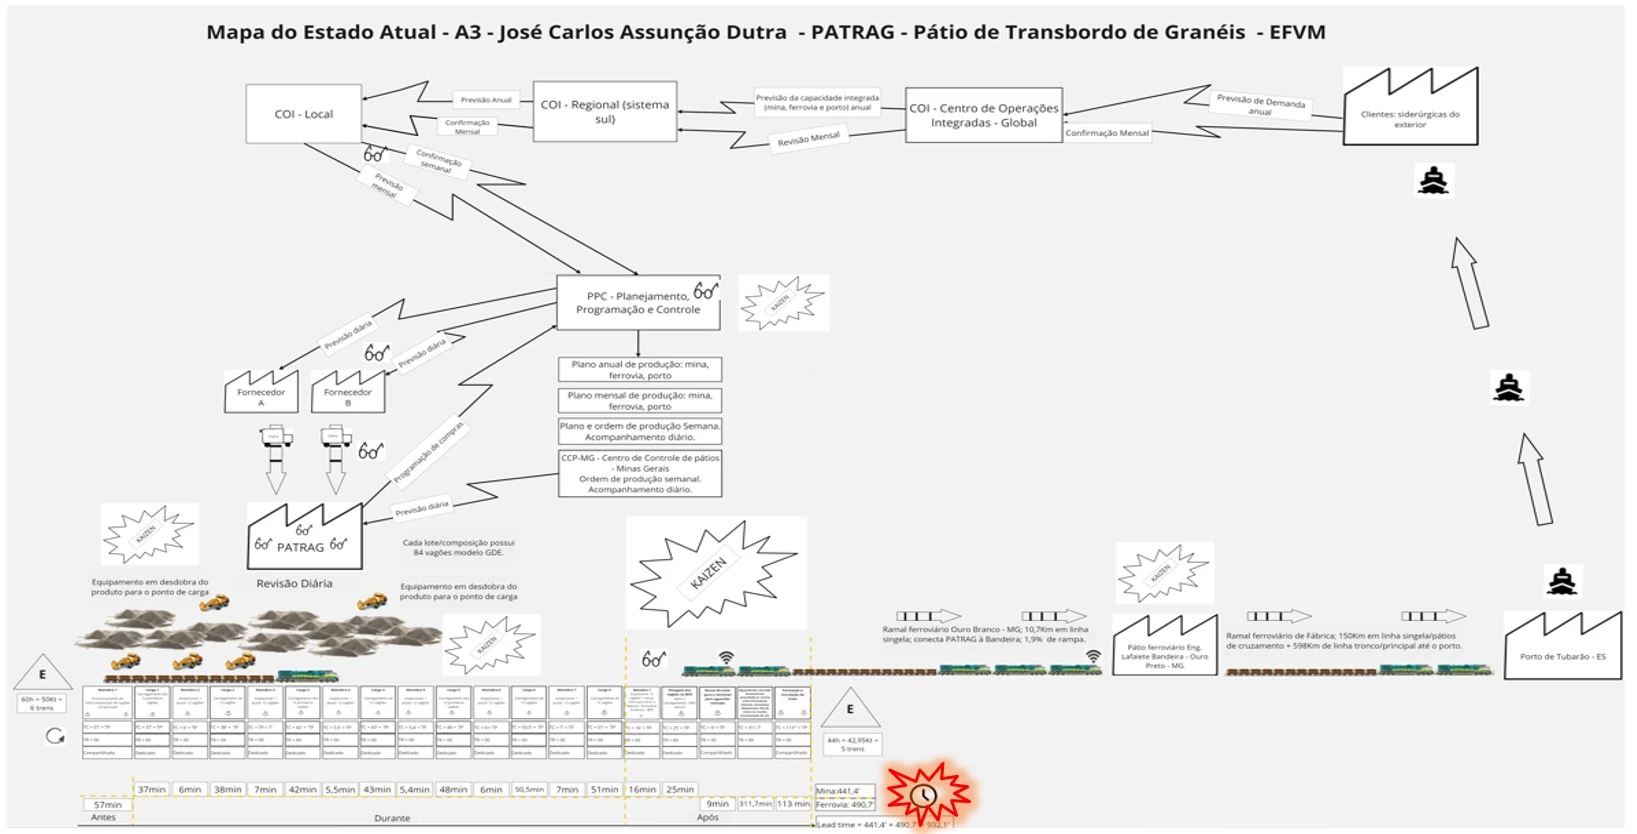
Figure 6. VSM – Current State of trains at PATRAG
Deepening the understanding of the problem
Railcar throughput time at the terminal was divided into its three stages — before, during and after loading — and categorized by “owner”: Mine and Railway, according to the team (mine or railway) responsible for the railcar at that point in the operation. Table 1 shows the actual times obtained through the Current State Mapping.
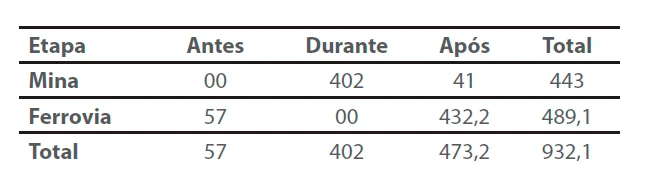
Table 1. Actual railcar throughput time at PATRAG (in minutes)
Based on the observations and the need for improvement to serve the customer at the port, targets were set for the stages of railcar throughput time, corresponding to step 3 of the A3 Form (Targets and Objectives). A main objective of cutting 40 minutes from the post-loading stage of the railcars was defined at this step. The targets are shown in Table 2 — the numbers highlighted in red are the targets not yet met when compared with the actual times in Table 1.
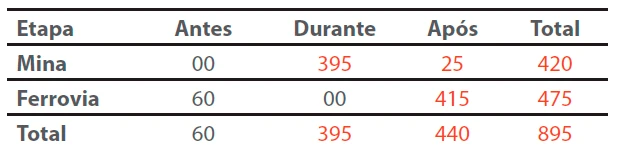
Table 2. Railcar throughput time target at PATRAG [in minutes].
From the data, it was observed that the main stage that would require the focus of the improvement study was “after loading.” In the Current State Map, the sequencing phases of the activities within the “post-loading” stage were also listed, covering everything from the end of loading to the train's departure for the next rail yard (Engenheiro Lafaiete Bandeira Yard). Figure 7 illustrates the activity sequencing scheme.
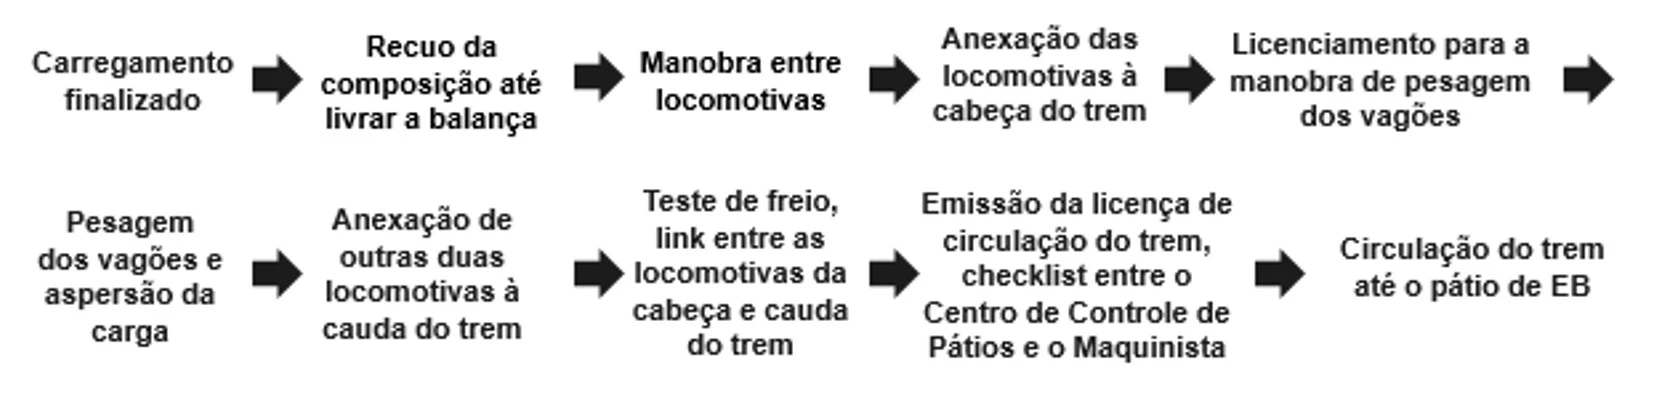
Figure 7. Sequential scheme of activities after loading of MFE trains originating at PATRAG – Current State.
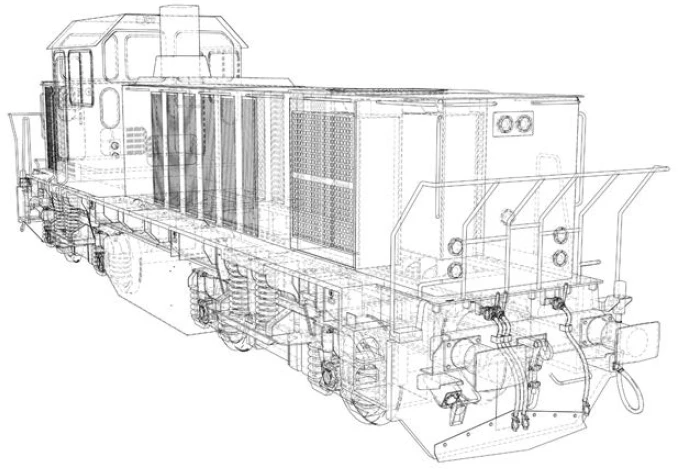
Next, the team used the Process Study Sheet (PSS) to collect times in the field and other observations of the work elements of the activities in Figure 7. The PSS made it possible to detail times and other variables from a more “micro” perspective than what is seen in the VSM, whose visualization objective is more systemic. Table 3 shows a completed PSS.
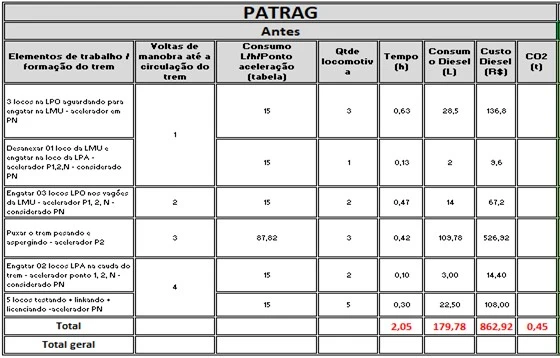
Table 3 – Process Study Sheet (completed PSS)
Closing the left side of the A3 and moving on to the right side
Next, following the sequence of steps of the A3 Form — corresponding to step 4 (Cause Analysis) —, the group analyzed the causes that were contributing to the increase in railcar throughput time, identifying the main ones by means of a diagram. Figure 8 shows the cause diagram and marks the main causes (X1, X2, X3, Y and Z).
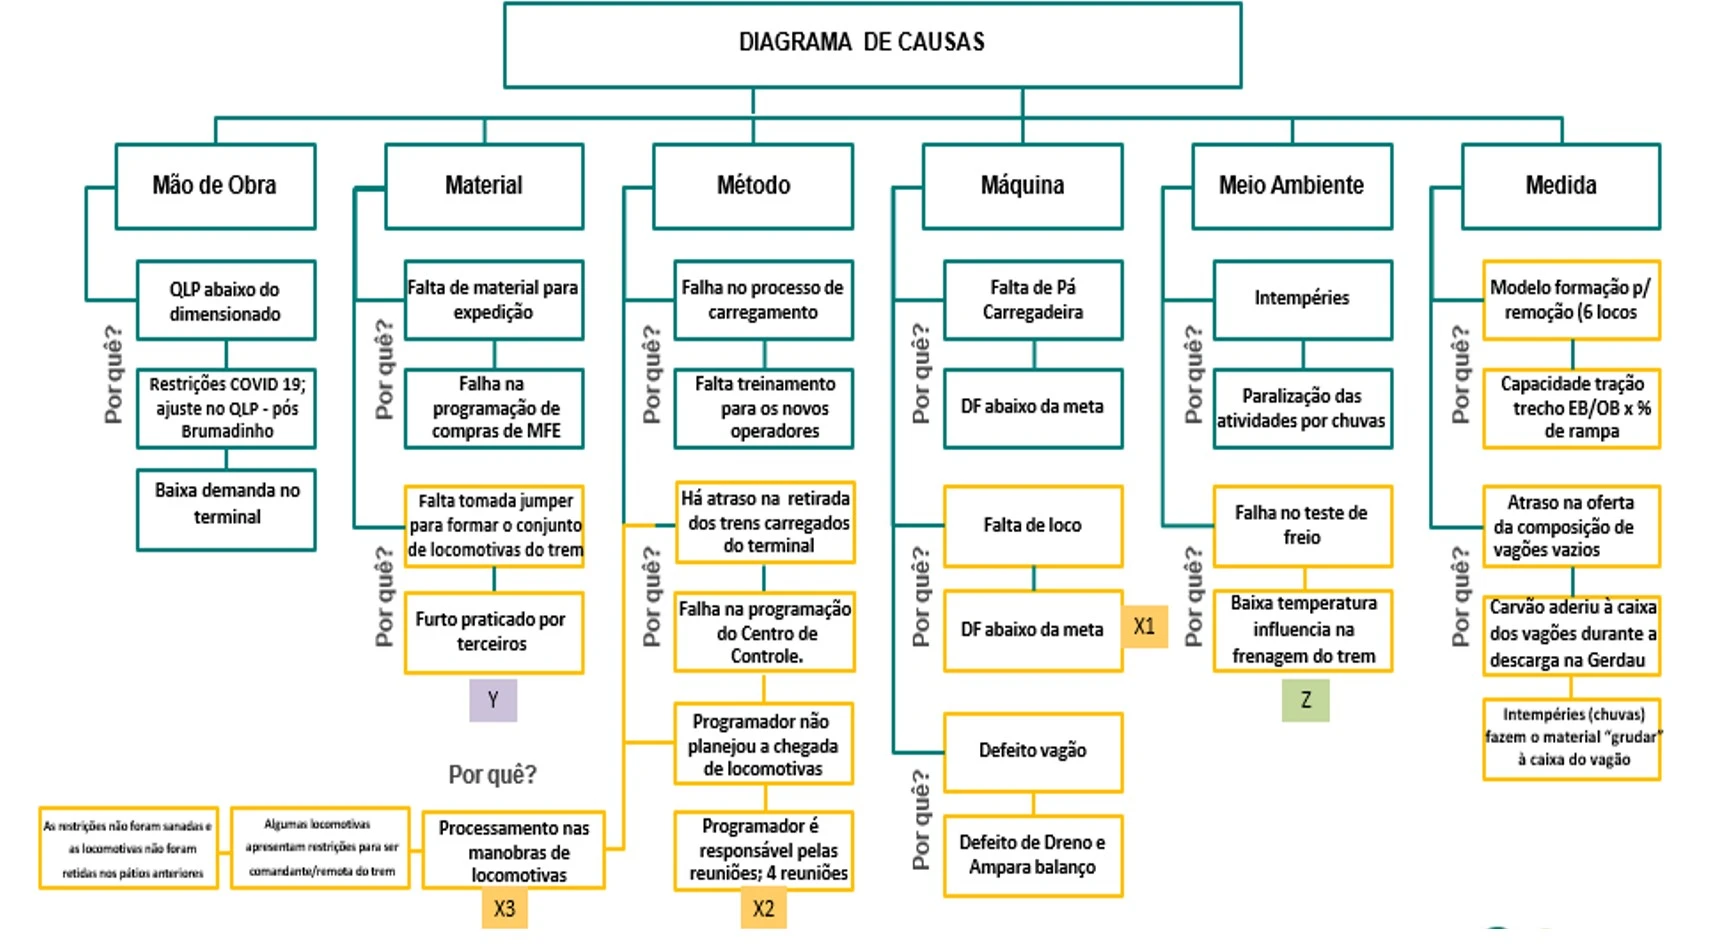
Figure 8 – Cause diagram developed
Based on the analysis, the project team identified at least two countermeasures for each root cause uncovered. Together with the future state value stream map, the countermeasures table makes up step 5 of the A3 Form (Future State), the first step on the right side of the form, described in Table 4.
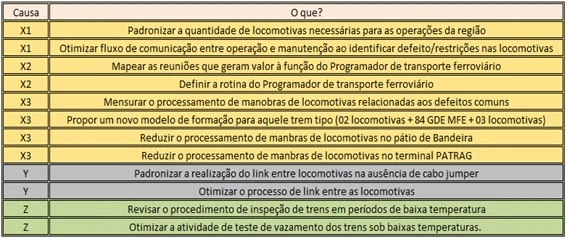
Table 4 – Proposed countermeasures for each cause identified
In step 6 of the A3 Form (Implementation Plan), the project team defined the step-by-step plan for the practical development of the countermeasures. The action plan can be seen in Table 5.
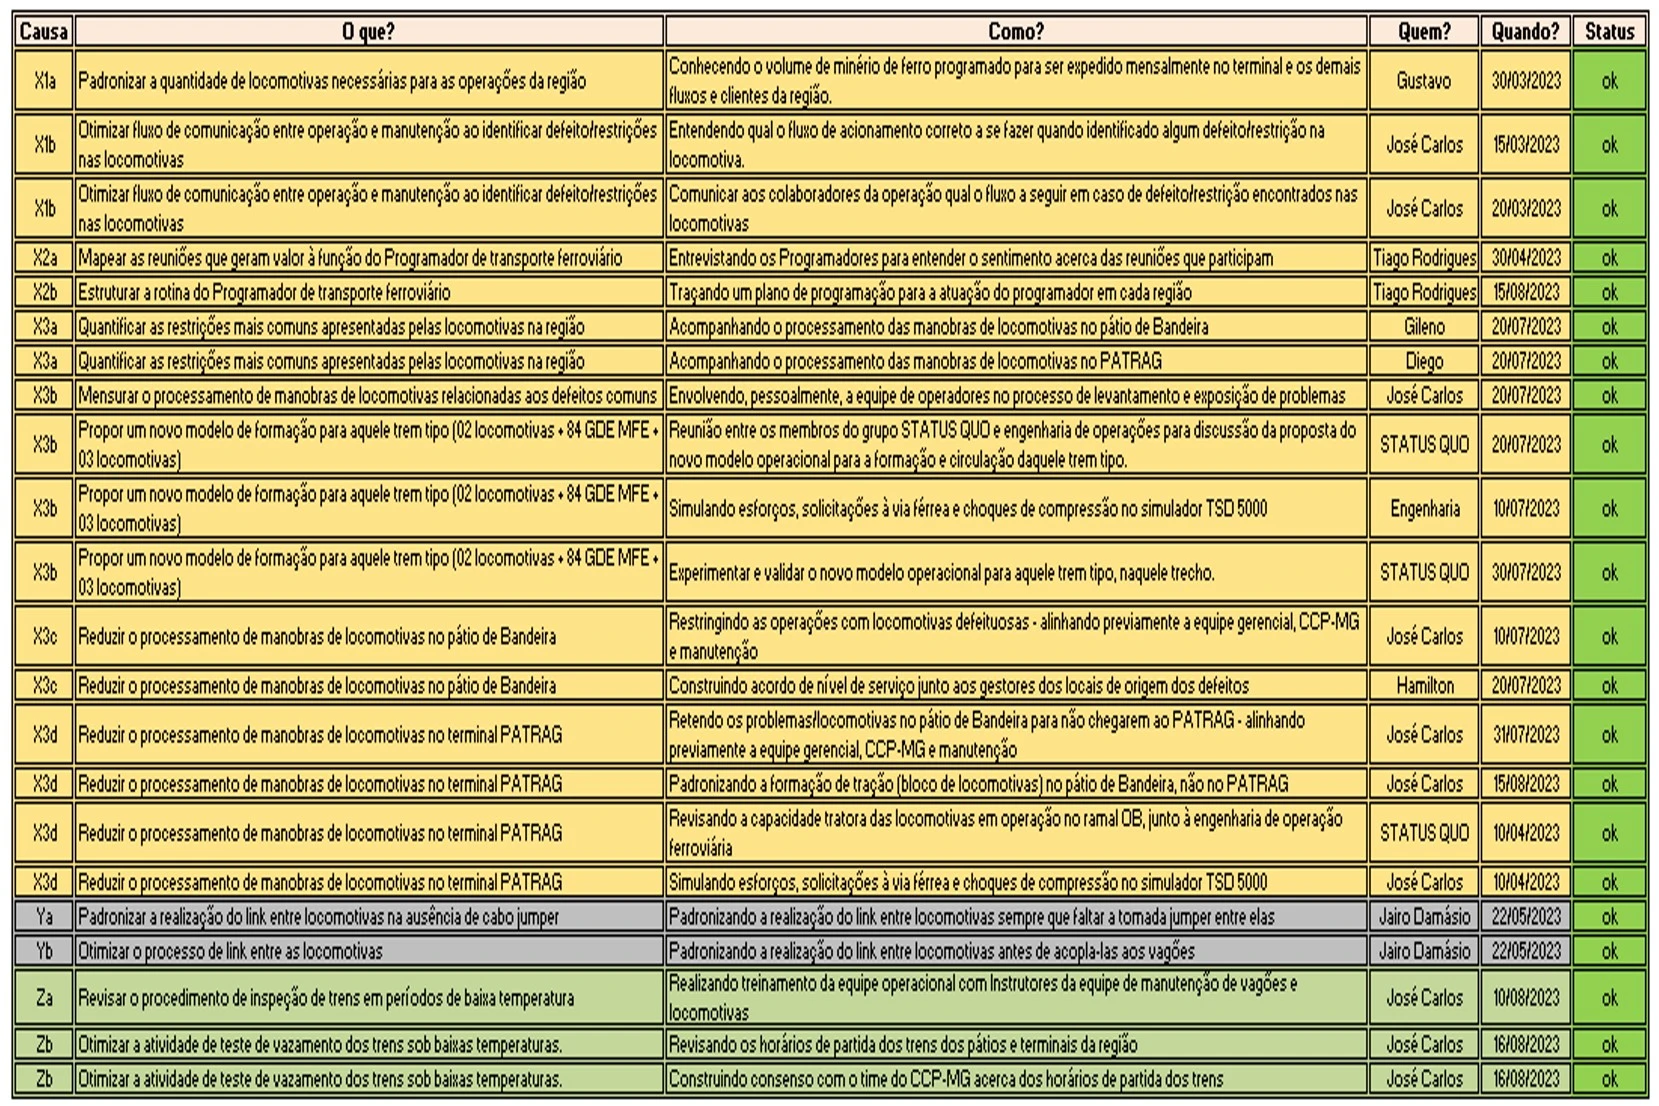
Table 5 – Action plan
Results achieved and next steps
The countermeasures were implemented and monitored for five months. The follow-up — which is step 7 of the A3 Form — made it possible to confirm that the objective set by the team for the “after loading” stage began to be met and sustained. A few issues remained to be addressed, but they fit into the continuation of the PDCA cycle as the issues that represent the next steps to be tackled and refined, carrying continuous improvement forward.
Other results were measured during the intervention period as a consequence of the project. The impacts were considered very significant for the period:
- A reduction of 726 shunting moves in train formation;
- A reduction of 254 hours in the overall railcar throughput time after loading;
- A reduction in consumption of 20,180 liters of diesel and biodiesel (88% and 12% shares, respectively);
- Savings of R$ 96,862;
- A reduction in emissions of 55.96 TCO2.
In summary, the operational redesign had a positive impact on the organization. Also as a next step, a “yokoten” (dissemination of the new practices and lessons learned) was initiated, planning to extend the improvement to the formation and circulation of trains with railcars loaded with steel products at the Ouro Branco Intermediate Yard.
Through the planned “yokoten,” new results will be stimulated, and new teams will be formed and trained to develop Lean practice. In conclusion, the practice of Lean thinking described in this article in the rail mode demonstrates its adaptability to the most diverse topics and everyday practices, sowing its structured and sustained approach to the continuous improvement of results.
With the continuation of Lean initiatives in the company, sharing its practice aims to contribute to the broad dissemination of Lean thinking so that it can increasingly serve as a means of improving organizations and society.
[1] Multidisciplinary team named “Status Quo,” made up of employees Diego Ramos, Gustavo Teixeira, Gileno Herculano, Hamilton Alves, José Carlos Assunção Dutra and Rosália Silva.