
Applying Value Stream Mapping in E-commerce: Mercado Livre

In this article, we analyze the lean management value stream mapping (VSM) approach applied to the e-commerce sector in a Mercado Livre fulfillment logistics operation. We begin by addressing the growth scenario of e-commerce and the advantages and challenges for those operating in this sector, and we introduce a method that provides a systematic and analytical view of all the activities involved in order to identify and solve problems: VSM. The step-by-step of how this approach was carried out is presented in detail, following eight stages of execution. The quantitative results in cost reduction and productivity gains are presented next. Additionally, we discuss the qualitative gains acquired during the mapping stages.
Electronic commerce has been the fastest-growing channel in the retail sector over the last decade, and buying and selling online has become increasingly common. The coronavirus pandemic (COVID-19) changed the way people made their purchases or sold their products, and e-commerce played an even more important role in maintaining the economic health of society.
With e-commerce, shoppers can not only enjoy the convenience of purchasing items anytime and anywhere, but online channels also offer retailers opportunities to sell their products directly to customers around the world without the need for a physical store. The advantages were even more evident during the pandemic, when shopping in physical stores was interrupted. At the same time, e-commerce saw increased competition with the entry of new players.
Retailers operating in electronic commerce face some unique challenges compared with those that sell their products using the traditional brick-and-mortar model. For example, delivery times tend to be longer, customer service is more complex because there is no direct interaction with the customer, and transactions of products, information and payments depend heavily on marketplace platforms and third-party logistics. To remain competitive in the market, it is important for these retailers to understand logistics problems and manage their supply chain effectively in order to reduce costs and improve the customer experience.
A traditional supply chain has several stages, from suppliers, manufacturers, distributors and retailers to, finally, customers. In this sequence of logistics activities, Fulfillment (Full) operations are an important link in the shipping environment, as they bring together a large share of the fundamental processes for meeting consumer needs and gaining speed in delivery times. Full processes must be interconnected to ensure cost competitiveness and offer a better buying or selling experience on the platform. Among the areas with which Full operations interface, we can highlight: technology, engineering, user experience and continuous improvement.
If there are problems in any of the Full processes, they can weaken the advantages of e-commerce and slow down the development of innovation. A systematic and analytical view of all the activities involved is useful for identifying problems and ensuring effective integration of logistics processes in order to reduce costs, improve profitability and consequently increase competitiveness in the market.
Value stream mapping (VSM) is a lean management approach that can be used to systematically measure, evaluate and integrate all the activities involved in operational processes. In this way, this approach aims to increase competitive advantage by reducing waste and consequently improving throughput time (lead time) to enhance value-added activities.
VSM was originally developed with the lean production movement and was initially used mainly in the manufacturing industry, but it has now spread to all company segments and economic sectors, especially logistics and supply chain. The concept of lean production was introduced by John Krafcik in 1988 and James P. Womack in 1990 as a management model for disseminating and adapting to other sectors the management models used by the Toyota Production System (TPS). This model was recognized for its effectiveness in productivity, continuous improvement, product quality and effective delivery to customers.
By helping us understand how activities and operations are connected, VSM establishes a baseline for the process to be analyzed and drives improvement. Since the central idea of lean management is to maximize customer value and minimize waste, this study aimed to analyze the application of VSM in the e-commerce sector in a Mercado Livre fulfillment logistics operation.
Value Stream Mapping (VSM)
The study conducted by Kumar (2021) showed that research on e-commerce is expanding to cover emerging technologies, innovative business models and applications focused on the vibrant growth of electronic commerce. However, there is a lack of studies addressing a systematic methodology that can be used to understand and evaluate the entire e-commerce logistics process in order to drive improvements.
VSM uses visual tools to show the flow of information and the flow of materials from raw materials to deliveries, which provides a systematic view of the processes involved in completing a product or service and leverages improvement.
VSM is a lean production methodology that became popular through the studies of Rother and Shook in 1999. Since the lean concept originated in the manufacturing industry, the first studies related to VSM focused on theories and practical procedures with applications in the manufacturing sector. Inspired by VSM research in this sector and by the effectiveness of the methodology, research efforts implemented VSM in other sectors to achieve productivity improvements, extending to Logistics and the Supply Chain as a whole. More recently, in Brazil, the application of VSM has also reached the product development process to identify waste, inefficiency and non-value steps.
Visualizing the VSM helps to understand the processes involved in supplying a product or service in order to identify waste, while the five whys method can be used to drill down to the root cause of the waste. The five whys method is the practice of asking why something is the way it is five or more times to get to the root cause of the failure and structure action plans that are better aligned with solving the problem. The method was originally developed by Sakichi Toyoda and was used at Toyota Motor Corporation during the evolution of its manufacturing methodologies. Since then, the method has been widely used in different problem domains because it is quite intuitive, easy to apply and highly adaptable. The five whys method has also proven effective in identifying the root causes of failures in many case studies in the manufacturing and service sectors
In Brazil, Lean Institute Brasil has applied the value stream concept through VSM in many types of companies, from industry to services, including analog and digital processes. This experience has also led to adaptations of the concepts introduced by Rother and Shook for applications in Logistics, shedding light on the critical points where the material flow connects with the information flows. For the case reported here, this previous experience was fundamental to enable end-to-end mapping, in stages, through division into Loops, which are well-defined delivery cycles within each macro flow. This provided a clear view of the connections between multiple resources and procedures in the operations of Mercado Livre, whose activity in e-commerce is on a large scale and still has prospects for spectacular growth.
Conducting the VSM Application
To carry out the application of VSM in the e-commerce sector in a Mercado Livre fulfillment logistics operation, an eight-stage method was followed; these stages were fundamental to understand, evaluate and improve the process flow. Figure 1 shows the sequence used in this study.
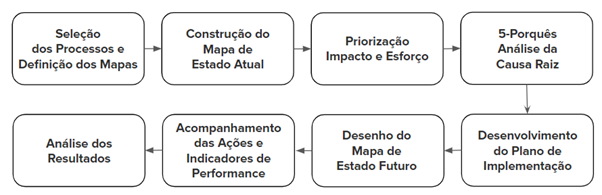
Figure 1. Methodological flowchart of value stream mapping
The selection of processes and definition of the composition of the Maps consists of subdividing the business's macro processes into smaller, more manageable parts, which we call "Loops". In this phase, it is extremely important to set up diverse groups (different areas and different hierarchical levels) that will take part in the VSM activity according to the subdivision of their groups (Loops). The purpose of setting up diverse groups is to draw out different perceptions of the same activity, which helps generate insights and better identify waste in operational routines. In all, 30 participants were assigned to 14 Loops in the fulfillment processes: 06 of them in Inbound processes, 05 in Outbound processes and 03 related to support area processes such as inventory and quality.
VSM classifies the activities of a process into three main categories, which are observed during the field activity for the Current Map:
- Value Added (VA),
- Necessary but Non-Value Added (NNVA) and;
- Non-Value Added and unnecessary (NVA).
. The goal of VSM is to make the flow of products, information and revenue more efficient by reducing NNVA activities and removing NVA activities, drawing up an implementation plan to optimize the time allocated to value-added (VA) activities. There are three basic interactive steps in applying VSM: building a Current State Map (CSM), formulating an Implementation Plan (IP) for the actions raised in the mapping, and drawing a Future State Map (FSM). Thinking through the Implementation Plan before the Future Map is an innovation of this approach, allowing the improvement opportunities to be understood in greater detail, so that the Future State is later drawn with more evidence and assertiveness, eventually leading to additional improvement actions in the IP. It is a process of making visible the path to reach the future state.
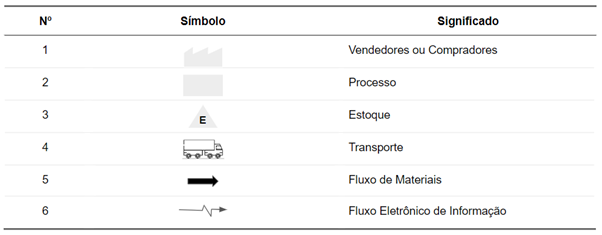
For a better view of the activities contained in the processes, symbols were used to represent different parts and links of activities and flows of a process in the VSM. The symbols used while building the mapping in this case and their meanings are listed in Table 1.
The second stage, building the Current State Map (CSM), consists of bringing the groups together to carry out field activities in the operation focusing on: a) identifying the sequence of activities in the processes, b) categorizing each activity according to value added, c) collecting the cycle times of each activity and d) identifying waste such as: inappropriate processing, overproduction, inventory, excess transportation, unnecessary motion, defects and rework, waiting and intellectual waste.
After the field activities, the CSM was built in an “obeya room”, a place set aside for assembling the maps, where, in this application, sticky notes were used so the group could better visualize the CSM. Figure 2 shows the current-state macro map of the overall flow of Mercado Livre's fulfillment processes as a general, schematic illustration.
Table 1. Symbols and meanings used in building the VSM
In the third stage, Impact and Effort Prioritization, we first numbered all the waste found in each of the activities, so that the participating group could indicate the level of Impact of each identified problem on the activity to which it is linked and the level of Effort required to reduce or eliminate that problem. In all, 132 activities were mapped across the 14 Loops, with a total of 482 problems associated with waste.
After prioritization, we arrived at the definition of four prioritization quadrants:
- High Impact and Low Effort (40% of the waste);
- High Impact and High Effort (36% of the waste);
- Low Impact and Low Effort (18% of the waste);
- Low Impact and High Effort (6% of the waste);
As we can see, 40% of the waste identified was in the first quadrant, high impact and low effort, which revealed potential for rapid progress in executing the actions and consequently impacting performance indicators, such as productivity gains, less idle time and fewer nonconformities, among others. Therefore, the next stage took as its starting point the problems identified in this first quadrant.
The fourth stage consists of applying the 5 whys for root cause analysis, starting with the high-impact, low-effort problems. Using the five whys method for each of the problems, it was possible to estimate the root cause and establish a countermeasure, that is, to make clear what should be done to eliminate or minimize that problem, which made the fifth stage a clear continuation: the list of actions to be included in the implementation plan.
The fifth stage, Developing the Implementation Plan, consisted of breaking down the countermeasure established in the root cause analysis into more detailed actions, with assigned owners and estimated deadlines, starting with experiments until the action was completed.
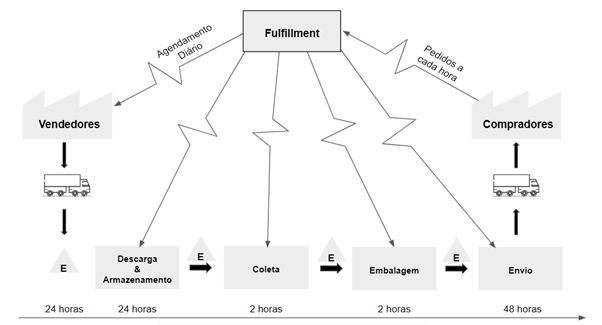
Figure 2. The current state of the VSM in a fulfillment operation
The sixth stage, Drawing the Future State Map, sought to reflect with the participants of each Loop in order to visualize what the direction should be in terms of the ideal process, so that this future map establishes clear guidelines on where we want to get to as the implementation plan is executed and as we keep learning from carrying out the actions. To draw this future map, the pursuit of a continuous flow sequence was taken into account.
The seventh stage, Tracking Actions and Performance Indicators, had the role of analyzing the progress of the actions implemented and the results obtained in the main indicators of that process; that is, the expected result at this stage is that the more actions are implemented, the greater the gain reflected in the indicators should be. If this ideal scenario does not occur, it is necessary to meet with the group again and review the root cause analysis and action breakdown stages so that the symptoms are correctly understood and the cause-and-effect relationship produces the expected result.
The eighth and final stage, Results Analysis, consists of tallying the total number of actions implemented and consolidating the overall gains of the operation, these being the sum of the results obtained by the loops carried out in the VSM. In this stage, several performance indicators were analyzed in each of the loops, such as Productivity, Cost, Service Level (SLA) and Customer Satisfaction (NPS), among others.
Results and Discussion
Four months after the value stream mapping and the implementation of the actions, we consolidated the results in order to assess the impact of the initiatives implemented in the VSM as a whole. To achieve this goal, two main performance indicators were taken into account, which we detail below:
- Cost per Order takes the total production volume (orders) and relates it to the total cost of the operation (labor, supplies, equipment, packaging, rent, among others);
- Gross Productivity takes the total production volume (orders) and relates it to the total labor cost paid.
To compare before and after the implementation of the VSM actions, we used as a reference the four months preceding the activity mapping process and the four months after the mapping, which also included the implementation of the prioritized actions. About 60% of the actions were completed in this period, most of them belonging to the highest-impact, lowest-effort quadrant; the remaining unfinished actions were either allocated to more complex projects or discarded because of their low impact on the activity, decisions made after the learning gained during the Implementation Plan.
Between the pre-VSM (April to July 2022) and post-VSM (August to November 2022) periods, an increase in production volume was recorded, due to the approach of the year-end holidays and peak-season promotions that cause seasonality at this time of year. Comparing the periods, order volume increased by +39.7% relative to the previous period, which normally causes costs to rise in non-standardized operations with high variability; however, that is not what happened in the post-VSM period: despite the increase in orders, the fulfillment operation recorded a reduction of -12.1% in cost per order, showing that the VSM actions were sustainable even with high order demand.
In addition, since most of the actions were related to optimizing operational flows and reducing cycle times, the Gross Productivity indicator was analyzed during these periods to confirm that the reduction in cost per order was not tied to commercial negotiations outside the scope addressed in the VSM, but was instead driven by process improvement and consequently better productivity. Comparing the periods, we observed that gross productivity increased by +11.6% compared with the previous period; that is, more orders were processed with better use of labor. Figure 3 illustrates the results measured in the VSM by the cost-per-order financial indicator and by gross productivity performance.
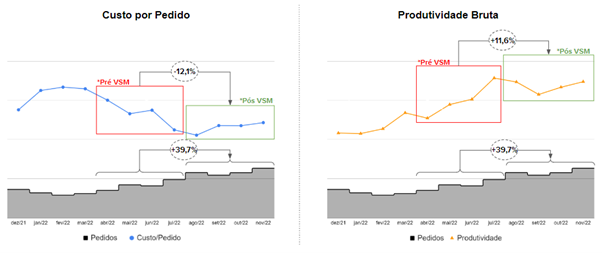
Figure 3. Results of the VSM application in Fulfillment
It is important to emphasize that, in addition to the very favorable results obtained with the application of lean management VSM, other qualitative results could be observed throughout this work. With the involvement of the participants and the engagement of leadership, VSM provided benefits that go beyond the periods analyzed; among these benefits we can highlight:
- Identifying waste in any process. Participants now have a much sharper eye for finding opportunities and drawing up an improvement plan.
- Pursuing the maximization of customer value. Placing the customer at the center of the activities led participants to change their thinking and become more critical when considering the impact on the chain as a whole.
- Encouraging communication and reinforcing the culture of continuous improvement. During the mapping sessions, all participants were heard, and the collaborative decision-making processes helped support and reinforce the culture of continuous improvement.
- Encouraging replication of the method to carry out new VSMs. Once the methodology has been absorbed, participants are able to lead new VSMs and inspire other participants.
Conclusion
In summary, this study found that lean management value stream mapping applied to the e-commerce sector, in Mercado Livre's fulfillment logistics operation, brought significant results through actions that led to waste reduction, shorter activity cycle times, elimination of unnecessary motion and an increase in the time devoted to value-adding activities, with these impacts reflected in the operation's cost-per-order and gross productivity indicators. Moreover, this lean methodology, used systematically in measuring, evaluating and integrating all the activities involved in the Full processes, was essential in contributing to a culture of lean thinking in decision-making.