

How to operate an ANDON

This article will explain one of the many ways Toyota uses the “Andon” to visually control the various stoppages of a production line caused by problems generated by the instability of the 4Ms.
We will also highlight how the operation of the system involves all production and support processes, how the warning is given in advance before the line stops, and how the other responsible areas interact at the moment of the crisis generated by a production stoppage.
1. WHAT IS ANDON
Andon is an important visual management tool when abnormalities occur, and it sits in the “Jidoka” pillar of the “Toyota House” (Figure 1), since it helps in the situation of “stopping and notifying abnormalities”.
Andon (see “Lean Lexicon”, pages 4 and 5, version 2.0, April 2007) is the Japanese term for “lamp”; it is typically an illuminated board with rows of numbers corresponding to workstations or machines, and it serves to detect a problem at those stations.
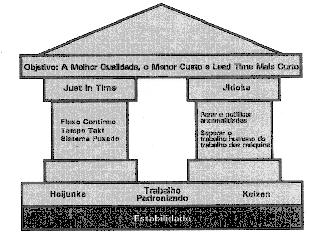
Figure 1: The Toyota Production System House (Source: “Lean Lexicon”, page 83)
As discussed in our article “Stability in the production areas at Toyota do Brasil”, to achieve production stability it is necessary to solve problems when they appear, as quickly as possible, using the scientific method or based on the knowledge and actions of the support team.
Andon is of utmost importance in this process of detecting and eliminating abnormalities within takt time.
2. PRODUCING WITHOUT ABNORMALITIES
The goal of every production operation is to produce as planned (Takt), using resources with the least possible waste. If the sizing was correct, the product would pass through the various workstations within the expected lead time, thus preserving continuous flow.
For example, on an assembly line where a vehicle being built moves through several stations, the product is moved by conveyors and the operators, through Standardized Work, follow the established pace and sequence, adding parts and components to the assembly.
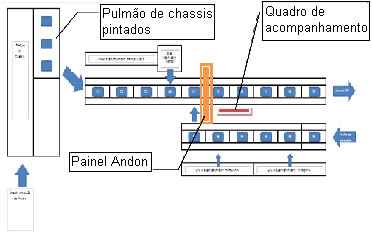
Figure 2: Assembly line, paint and subassemblies (top view)
In Figure 2 we show the final assembly area of a vehicle. The painted chassis sits in a buffer waiting to enter the chassis assembly line (C1~C5), where components, rear and front axles, drive shafts and piping are assembled, and at stage C4 the engine and transmission go in. At stage C5 the body coming from the Trim line (T6) is positioned.
Leaving the Paint shop, the body enters the Trim line (T1~T6), where components such as seats, instrument panel, interior linings, glass and others are added. After the last stage, the body is then positioned on the chassis at station C5, and the vehicle receives its final finishing between stations F1~F5.
At stage F1 we have the production tracking board, where all the problems that caused line stoppages were recorded. If there are no problems or abnormalities at any of the workstations, the leader records on the production tracking board (which is posted near the Andon) the quantity produced, both per period and cumulatively.
For example, in the 9:00~10:00 period, no production problem occurred and so the quantity produced was as planned, 2.00 vehicles, with no minutes lost (see Figure 3).
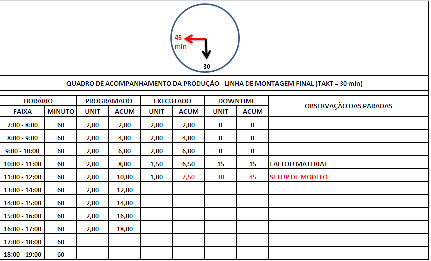
Figure 3: Hourly production tracking board
3. ABNORMALITIES APPEARING
The indicator used to measure stability is downtime (production time lost due to planned or unplanned stoppages, see “Lean Lexicon”, page 19). When planned production was not achieved, every reason for stoppage was quantified (how long) and qualified (what happened).
Monitoring is done through the “Problem tracking board” (see “Creating Continuous Flow” – Mike Rother & Rick Harris, p. 86), usually filled in by the area leader, with the production supervisor or manager checking it during breaks and management at the end of the day. The goal was to reach an efficiency of at least 95% relative to plan in quantities or allowable stoppage time.
But before stopping production and recording the downtime on the production tracking board, a device was activated to warn everyone of the imminent danger: a problem is appearing. Whether a defect, bad material or a lack of it (Material), a problem with the fixture or machine causing delays (Machine), the absence of an employee (Manpower), or a prolonged setup (Method), the operator pressed a button or pulled a cord (see “Lean Lexicon”, Fixed-position stop system, page 81) to signal that he was having problems. Production did not stop immediately, but the “Andon” registered that the workstation was in difficulty, and if nothing was done after a few minutes, the line would stop.
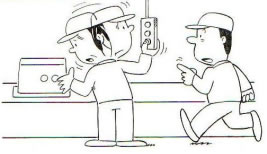
Figure 4: Line stop button at Stage F-2
On the Andon board, after the operator at Stage F-2 activates it (see Figure 4), a yellow lamp lights up and the leadership has one tenth of the Takt to solve the problem. If no countermeasure has been taken after that time, a red lamp lights up, indicating that the line has stopped until the situation is resolved. We will see the explanation of these Andon signals later in this article.
If, for example, the line stops due to problems that have occurred, a clock located above the production tracking board is started and begins to record how long the line was stopped for this reason. This clock will indicate the total production stoppage time for the day.
As an example, in the 10:00~11:00 period there was a material shortage due to model variation and the line fell behind. So if the line was stopped for 15 minutes and the Takt is 30 minutes, this means that this waste caused the loss of 0.5 vehicles in that 1-hour period (see Figure 3).
On the Andon Board, the situation will show that on the Final Line, Stage F-2, position 5, a problem occurred that stopped the line as a whole (See Figure 5).
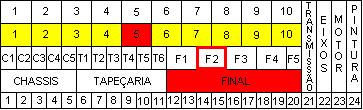
Figure 5: Assembly Line Andon Board
This “production stopped” situation, with the Andon visually indicating where the problem was, called for urgent action by the support team from the other areas, and, as described in the article “The Role of Leadership at Toyota”, everyone went to the gemba for an immediate solution.
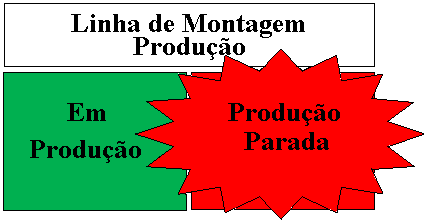
Another type of information generated by the production line Andon was that this board was linked to other Andons within the factory and the office. In the senior management office there was a simple Andon with a green lamp and a red one. When the line was “running”, the green lamp stayed lit, and if the line happened to stop, the red lamp lit up, indicating a problem (see Figure 6). When this happened, senior management also went down to production to help identify the problem and take corrective measures.
4. HOW THE ANDON WORKS
The first row of “white” lamps (item “a”of Figure 7) indicates the work cadence, showing each operator at what point in the work sequence they should be. These lamps light up in sequence from 1 to 10 and are linked to the speed of the conveyor.
The second row of lamps (item “b” of Figure 7) indicates whether the line is about to stop when a yellow lamp lights up. If position “5” is lit, this means that at some stage at position “5” (marked on the floor). If the red lamp lights up, it indicates that the line has stopped completely.
The third and fourth rows of lamps (item “c” of Figure 7) indicate at which stage and on which line the stoppage occurred, to make it easier to identify where the problem happened.
The fifth row of lamps (item “d” of Figure 7) indicates the point-of-use shelves (see POU, “Making Materials Flow”by Harris, Harris and Wilson, page 48) or the supermarkets that supply the production line. The importance of these lamps is to identify at which point a material shortage may occur, since the minimum inventory point has been reached.
The last group of lamps is intended to show which supplier process is having problems or when some type of defect has been identified. To explain further: for example, when the Transmission assembly area finds a problem with a machined part, the area leader flips a switch that lights the “Transmission” lamp on the assembly line Andon and also in the Machining area that supplies the part. That way everyone knows immediately that we have problems.
The Andon board made up of these lamps visually represents all the workstations of the assembly line and subassemblies. For each work stage of the main line there are 3 positions: white (cadence lamps), yellow and red.
The moment the operator presses the button, the yellow lamp lights up and a shrill sound echoes through the factory, informing the area leader and the supervisor that that stage is facing a difficulty because some kind of problem has appeared. After a certain time, if nothing is done to eliminate the problem, the red lamp lights up and the entire assembly line stops, and music starts playing that can be heard throughout the area. A stopped assembly line means that all upstream processes will also stop, namely those in continuous flow or pulled by kanban.
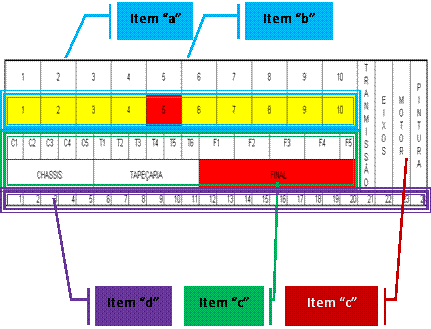
Figure 7: Andon board (description of the lamps)
The importance of the yellow lamp (item “b” of Figure 7) is that the leadership has a finite time to act, either with containment so that the problem is not passed on or with a definitive solution. In this case we are talking about actions to prevent the line from stopping, and the reaction time until a complete stop is equal to one tenth of the Takt. In other words, the support staff have 3.5 minutes to solve the problem before the stoppage.
The red lamp tells everyone that the problem has not been solved and that the station must not pass the problem on. The Andon pointing to the stopped station triggers the arrival of the entire support team, from the engineering, maintenance, quality, supply, management and executive areas, and the problem is then escalated to higher levels. In the same way, this group tries to solve it, temporarily or permanently, quickly, since the line and the factory as a whole are “stopped”.
5. FLOOR MARKINGS, ANDON CADENCE AND STANDARDIZED WORK
As mentioned in the previous section, the first row of Andon lamps (item “a”of figure 7) indicates the work cadence and makes clear to the operator what work he should be doing. These lamps light up in sequence from 1 to 10 and are linked to the speed of the conveyor.
Each work stage has 10 divisions, as shown in Figure 8 below, and each division is correlated with lamps 1 to 10 (See Figure 8, Detail “a”). So if lamp 5 is lit on the Andon, this indicates that the front axle (the vehicle's reference point in the work stage versus the Andon) is positioned at floor division “5” (see Figure 9).
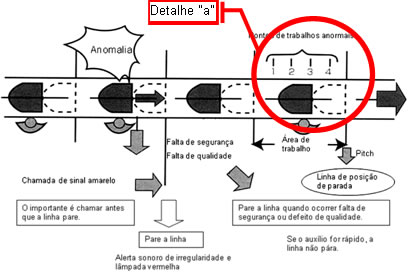
Figure 8: Floor markings for each Stage
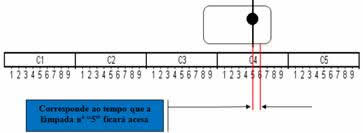
Figure 9: Floor markings for each Stage (Detail “a”)
At each division of his stage, the operator must perform a series of work elements according to the distribution made by the leadership (see “Creating Continuous Flow” – Mike Rother & Rick Harris, pages 51~61). In this way we can have Standardized Work as shown in Figure 10, where each element is “tied” to the floor divisions and the Andon.
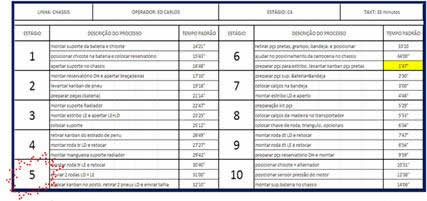
Figure 10: Standardized Work, floor markings and Andon
The floor markings with divisions as in Figures 8, 9 and 10 make it easier to identify each employee's work stage when we have very “long” Takt Times, above 1 to 2 minutes. For “short” Takt Times, these markings lose their effectiveness.
6. HOW TAKT TIME IS REPRESENTED ON THE ANDON
As stated earlier, each work stage is divided into 10 parts, numbered 1 to 10, with the reference being the line of the vehicle's front axle. Since we have 1 vehicle positioned at each work stage, in theory they are all in the same position, because this is a line where the vehicles are loaded starting from the painted chassis, and the white lamps (item “a”of Figure 7) turn on and off according to the cadence set by the conveyor.
For example, as soon as the painted chassis is placed at station C1, it is positioned so that the axis of symmetry of the front axle is at division 1, and the conveyor then keeps “pulling” it forward. Between divisions 1 and 2 there is a series of work elements that must be done by the operator at this station, and until division 2 is reached the other white lamps are off, except the lamp for position 1. As soon as the vehicle reaches position 2, lamp 1 goes off and lamp 2 lights up. And so all the operators, by looking at these white lamps, know exactly whether they are behind or ahead, always following Standardized Work.
The “on” and “off” of the white lamps is done by “devices” positioned on the conveyor chains along their entire length, at the same spacing as the floor markings. In Figure 11 we can see that these devices actuate an electrical switch (micro switch) that sends electrical signals to the Andon.
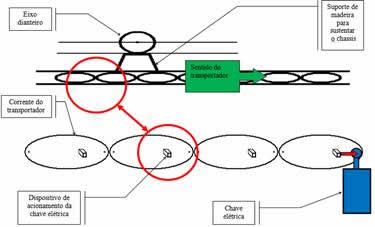
Figure 11: Actuation system for the Andon cadence lamps
To calculate the conveyor cadence we need to “convey the image of takt time”, and for that we determine the “Line Speed”, that is, the speed the line must have in order to meet demand. As seen earlier, if we have a Takt of 30 minutes, each division of the work stages must take 3.0 minutes for the chassis to travel.
In the case illustrated in this article, each work stage is 10 meters long, and dividing 10 meters by 30 minutes gives a speed of 0.33 meters per minute. This is how we establish the equivalence between takt time and Line Speed, and so we can determine a range of speeds that meets several Takt’s, and thus define the type of equipment (in this case the conveyor) to be purchased or designed.
7. HOW TO ADAPT TO CHANGES IN DEMAND
When demand changes, that is, when the Takt changes, the line speed (Line speed) must be changed. Changes in takt time were normally anticipated by observing the behavior of demand and its trends.
Thus, always one month in advance, all the planning was prepared with the calculation of the new Takt, followed by the Line speed, the standardized work of all people (new distribution) and the layout. Two weeks in advance we tested the new configuration so that problems could be detected before the change was made official. The purpose of this procedure was to give production the time it needed to “settle” (eliminate all waste) into the new layout and work distribution.
When there was no change in demand (Takt) and the plan was always achieved (waste identified and eliminated), it was an opportune time for senior management to increase the Line speed a little more, in order to “let” more waste surface. This was the focus for the continuous elimination of waste.
For the Andon board, nothing changed physically. With the change in demand, the conveyor speed had to be modified through a motor-variator unit, which transmits various speeds (various Takt’s) to the line. Naturally, during the design of the conveyor, the speed variation range must be taken into account to meet the possible Takt’s.
8. HOW THE OTHER AREAS LEARN ABOUT PROBLEMS
On the same Andon board, the main subassemblies, such as trim, transmission, chassis and axles, had a red lamp that lit up when there were problems with these parts on the assembly line or in their own work. If there were problems, they originated from body Painting, Machining, Body Shop and Chassis.
For example, let's say that during transmission assembly a defective gear appeared that would stop the subassembly. It is up to the leader of this area to flip a switch, which set off an alarm in the Machining office informing that the management of this area should go to the Transmission subassembly area. If the problem happened not to be solved, the assembly line stopped and the red lamp for the transmission area on the Andon lit up. At the same time, a red lamp also lit up in the management and executive offices, warning that all production had stopped.
Immediately all of senior management and the support team (Engineering, Maintenance, Supply, the managers of other supplying production areas, etc.) went to the Gemba to learn about the problem and help solve it.
In Figure 12 we see that the Assembly Line Andon board indicates that there was a stoppage (problem) caused by the transmission subassembly, which alerted the Machining area responsible for the part so that the leadership of the areas would be sent to solve the problem. In parallel, senior management and the administrative areas are also notified “visually” so they can help with the solution.
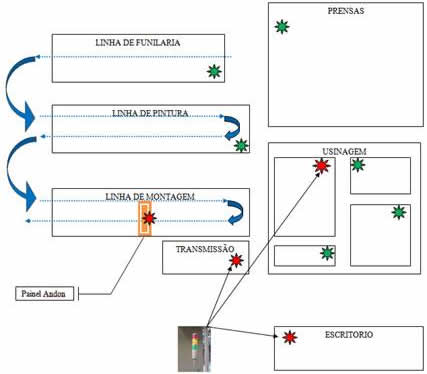
Figure 12: Information system between areas
9. ANDON EXAMPLES
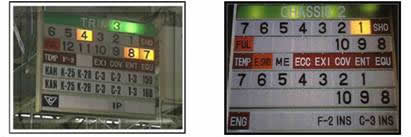
Figures 13 and 14: Andons for Trim and Chassis lines
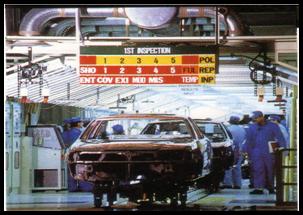
Figure 15: Andon for the Paint line
10. CONCLUSION
It is not enough to build “showcase spaces” and put up several boards with the main indicators, tracking boards, or illuminated boards showing how much should be produced and how much is being produced, if there is no systematic approach to exposing and solving problems.
An important differentiator of the Toyota Production System is people's commitment and involvement in solving problems, but even more important is that problems become visible so that waste can be eliminated.
Andon is an important visual management tool, but only when well managed, because it shows the Takt rhythm to all workstations (the standard to be followed), regulates the operators' Standardized Work, identifies where the problem is occurring or has occurred, and triggers an entire “Help Chain”, starting the cycle with the area leader, passing through the supervisor, managers and directors, and reaching a cross-functional group made up of people responsible for several support areas.
Andon is of utmost importance in this process of detecting and eliminating abnormalities within takt time, but it does not solve problems on its own; it depends on people's commitment.
Bibliographic references:
HARRIS, Rick, HARRIS Chris e WILSON Earl. Fazendo Fluir os Materiais. Lean Institute Brasil, Versão 1.0, Maio 2004.
ROTHER, Mike e HARRIS, Rick. Criando Fluxo Contínuo. Lean Institute Brasil. Versão 1.0, Janeiro 2002.
MARCHWINSKI, Chet e SHOOK John. Léxico Lean. Versão 2.0, Abril 2007.