
Improving Performance in a Customer Relationship Center
This article aims to present and discuss the application of Lean concepts in administrative processes for the continuous improvement of customer relationships at the Customer Relationship Center of a consumer goods manufacturer.
The main goals of the Lean application were to increase the area's productivity and to achieve greater speed and accuracy in customer service, involving the entire team.
Through a survey of all the activities performed by 65 employees and an internal survey of the business areas, several improvement opportunities were identified in the customer service processes.
The results of the survey and of the activity analysis guided the launch of more than 30 projects aimed at improving processes and studying the area's layout. To ensure the continuous improvement of processes, it is necessary to create an environment where people take an interest in problem solving, exposing problems openly, and are willing to constantly evaluate the way they carry out their activities.
Lean in administrative processes
Applying the principles of lean thinking from manufacturing to administrative activities has certain particularities compared with manufacturing. The value stream, in this case, consists of the flow of information and knowledge, where the objective is precisely to reduce or eliminate the waste associated with it. (MCMANUS, 2003).
As in manufacturing, waste in administrative areas consists of activities that add no value to the product, the service or the customer, adding only cost and time. Because of the particularities of administrative processes, a classification of waste different from that of manufacturing is needed, so as to make it easier for people to see it. To this end, we initially separated waste into three large groups:
- Boundary Waste
- Knowledge Waste
- Planning Waste
Owing to the functional division and departmentalization present in companies, it is common for information in administrative processes to be transferred between people and departments. Boundary waste is caused by what we call “hand-offs,” that is, the loss of knowledge inherent in this transfer of information. The “hand-off” is also associated with a physical layout that leads to a high volume of movement between areas. Boundary waste is classified as:
- Useless information: the effort and cost of collecting information that is never used, generating more information on paper than necessary (excess paper or bureaucratization);
- Waiting: For data, signatures, answers, decisions, review events and availability (of people or machines). This can be, for example, an excess of signatures and reviews on documents at different levels of the organization. This waste causes misalignment with an organization's strategic business vision;
- Large batches of information: Waiting for large waves of information to proceed with the process;
- Redundant tasks: inspections and reviews, for example.
Knowledge waste is caused by people's constant need to use their creativity, which can generate problems. It is classified as:
- Reinvention: reinventing or re-creating knowledge
- Quality Problems: rework and poor-quality information.
Planning waste is caused by the lack of a systemic view of administrative processes and of their interaction with and impact on other parts of the process. It is classified as:
- Lack of Workload Leveling: generating queues, overloads, idleness and a lot of variation in lead time;
- “Stop and Go” tasks: interruptions during the thought process of an activity, which require a new mental “setup”;
- Lack of synchronization between tasks: working out of step with the moment that suits customers' needs. An example would be reports produced in excess that sit archived on computers
The Customer Relationship Center of the consumer goods company
This is a company that produces more than 15,000 items. The Lean philosophy is widely used in its factories as a management model to support the continuous improvement of processes.
The Customer Relationship Center (CRC) is a department that deals exclusively with relations with the market, including customers and the sales team.
The application of Lean at the CRC began in 2009. The application plan was structured in five stages: define, measure, analyze, improve and control.
. The first step was to define the team that would take part in a workshop on Value Stream Mapping in Administrative Processes and on Problem Analysis and Solving. The purpose of this workshop was to familiarize the office team with the philosophies and tools of lean thinking.
. The next step was to measure all of the group's activities using an activity survey spreadsheet; in all, 65 people took part in the activity survey, which made it possible to identify waste and critical points of the process in light of customers' expectations.
To measure internal customers' perception of the value of these activities, a Voice of the Customer survey was carried out. For this, the Kano Model (KANO, 1994) was used, which deals with attractive and must-be quality and distinguishes between three types of product and service attributes that influence customer satisfaction:
- Must-be attributes: fulfill the basic functions of a product. Customers will be dissatisfied if these attributes are not present or if their performance is insufficient. On the other hand, the presence of these attributes does not result in customer satisfaction.
- One-dimensional attributes: customer satisfaction is proportional to the level of performance; the higher the performance, the greater the customer satisfaction, and vice versa.
- Attractive attributes: bring more than proportional satisfaction and do not cause dissatisfaction if they are not met.
The identification of attributes within the Kano Model is based on a questionnaire in which the customer indicates whether they are satisfied or dissatisfied with a given situation. Figure 1 illustrates the model:
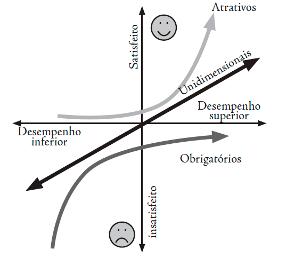
Figure 1: Kano Model of Attractive and Must-Be Quality
Source: Adapted from Matzler et al, 1996.
The survey was answered by 294 people and was intended to classify the CRC's main activities. The activities performed by the team were analyzed, and improvement opportunities were identified to better serve internal and external customers.
The result of the survey was translated into a chart relating service or requirements to customer perception.
It was concluded that order status and complaint handling activities were among those considered most basic, leaving little time to act on the processes most valued by the internal customer.
. The next step was to analyze the data received. What we discovered by crossing the results of the survey with the results of the activity survey was:
- The main activities were related to order status inquiries, ranging from answering calls and querying internal databases to returning the information. The time spent on these activities represented more than 15% of the work and, in the survey, was considered a basic activity by customers;
- Order analysis and processing took up another 15% of employees' total time and was also considered a basic activity;
- Between 5% and 10% of the time was spent handling complaints; Activities were frequently interrupted;
- A very large number of activities were treated as urgent, making it difficult to prioritize efforts.
Next, the improvement actions were defined. The results of the survey and of the activity analyses guided the launch of more than 30 projects aimed at process improvement. Among these, we can cite the initiatives below:
- Automation of order entry;
- Reduction of the order processing cycle;
- Making order status information available for customers to check through electronic tools;
- Reduction of errors in processes;
- Modernizing the telephone system;
- Greater availability of employees for managing and carrying out processes that add value for the customer.
In parallel with these activities, the area's current layout was analyzed, since the physical arrangement of the environment, furniture and equipment in any workplace is of the utmost importance for people's productivity, as well as for the workflow and the good visual presentation of the place. Through this study we found that there was a great deal of waste due to the layout, including:
- The high level of noise affected people's concentration, which resulted in “stop and go” waste;
- Waste due to quality problems: the area is divided into four supervisory units, and their teams were far from their respective leaders. People were arranged in cubicles, which hindered team integration; Waste due to large batches of information: all documents generated were filed in a physical space, and searching for them took time;
- Leveling waste: Every hour, employees collected the orders to be keyed into the system by operational support. This operational support team was located in another building, causing queues of orders waiting to be keyed in, idleness and variations in order processing lead time;
- Waiting waste: operational support waited for orders on a preprinted form in order to key them in, and people waited for the return of documents needed for follow-up.
See the old layout in figure 2:
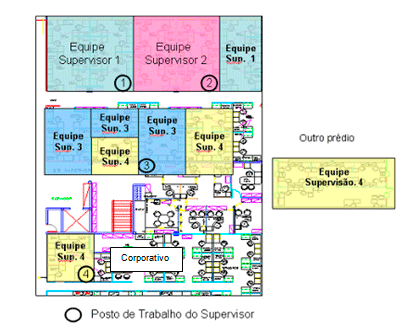
Figure 2: Old CRC Layout
Several opportunities were identified through the Layout study, and the improvement for these opportunities was a layout change that sought to meet the following objectives:
- Bringing leaders closer to their team and giving them a view of all the employees in their area;
- Team integration, aiming to improve productivity;
- Bringing operational support closer to the CRC, aiming to reduce order lead time through improved quality and productivity;
The layout change was conducted as an evolutionary and necessary process, carried out with the participation of the whole team through improvement suggestions and with attention not only to the physical arrangement but also to ergonomic factors: lighting, noise level, colors, ventilation and temperature.
The new Layout was designed in a linear fashion and included a rest area, a kitchenette, lockers for personal belongings and a meeting room. The newly built space was named “Espaço CRC” (CRC Space). See figure 5:
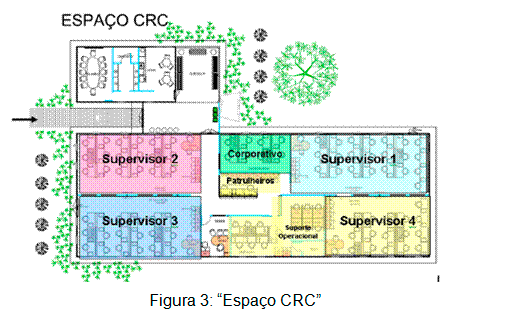 Figure 3: “Espaço CRC”
Results
The implementation of Lean at the CRC aimed at speed and accuracy in customer service, combined with identifying the causes of any problems pointed out by customers.
The quantitative results obtained were:
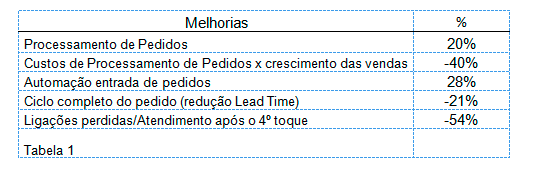
- With 2.7% fewer human resources, we increased order processing by 20.2%; 2010 vs 2008;
- An average increase of 41.12% in cost productivity (the difference between the percentage growth in sales and the percentage cost of the operation); 2010 vs 2009;
- An increase of 27.5% in the automation of order entry; 2010 vs 2009;
- A reduction in the percentage of requests for order inquiries by making order information available through electronic tools;
- A 20% reduction in the order processing cycle;
- A 53.6% reduction in missed calls; 2010 vs 2009;
We can also list some qualitative gains, such as:
- Identity as a work team;
- A pleasant work environment;
- Elimination of document files. Today all documents are digitized and can be searched online;
- Speed and accuracy in customer service;
- Better ergonomics
Through the Lean philosophy we are: focusing employees on the processes that really matter; better understanding our activities; anticipating problems; bringing leadership closer to employees; creating a culture of continuous improvement; making the organization aware of customer requirements; and engaging employees.
Conclusions
Implementing the Lean methodology in companies means the continuous elimination of waste and doing more with less. Waste is a symptom of problems, and analyzing it shows us opportunity points in the system.
As in manufacturing, waste in administrative areas consists of activities that add no value to the product, the service or the customer, adding only cost and time. Because of the particularities of administrative processes, we identified the need for a classification of waste different from that of manufacturing, so as to make it easier for people to see it. To this end, we arrived at a total of nine wastes in administrative processes, divided into three large groups.
The task of transposing manufacturing concepts to the office is not simple, because in manufacturing the processes involve physical materials such as raw materials and machines, so it is possible to see clearly when a product on the production line has defects or when resources are idle.
Applying lean in the administrative environment becomes more complex because it deals with a flow of information, and administrative processes are rarely designed to be excellent. Most of the time, they are the result of practices that end up becoming flows. We can cite some of the problems in office environments: nonexistent or deficient control of the information flow; problems regarded as part of the process; absence of data and indicators.
To ensure the continuous improvement of processes, people must be bothered by the expression “it has always been done this way” and expose everyday problems in order to solve them. It is possible to do things differently, and it must be done now.
The results indicate that lean concepts and tools can be used in administrative areas as well as in any sector of the company, provided there is a problem or an improvement opportunity and people interested in solving it.
Bibliographic References
BERGER, C. et al. Kano’s methods for understanding customer-defined quality. Center for Quality Management Journal, Cambridge, v.4, p. 3-36, Fall 1993
KANO, N. Attractive quality and must-be quality. The Journal of the Japanese for Quality Control, v. 14, n.2, p.39-48, Apr. 1984.
MATZLER, K. et al. How to delight your customers. Journal of Product Brand Management, Bradford, v. 5, n. 2, p. 6-18, 1996.
McMANUS, H. Product Development value stream analysis and mapping manual (PDVMS) – Alpha Draft. Lean Aerospace Initiative. Cambridge: Massachusetts Institute of Technology. 2003